linechart
linechart, tile type
The linechart is a tile that displays daily, weekly and monthly time-series.
// Day, Week and Month, the special calendar tables are implicitely created by 'span'
keep span date = [date(2021, 5, 1) .. date(2021, 7, 30)]

Day.X = random.poisson(5 into Day)
Week.X = sum(Day.X)
Month.X = sum(Day.X)

show linechart "Daily" with Day.X
show linechart "Weekly" with Week.X
show linechart "Monthly" with Month.X
The tile linechart requires the Day table to be defined. The Day table is a special calendar table. It cannot be created by the usual means in Envision. The table Day can be created with span as above, or through a expect [date] in a read block:
read "/orders.csv" as Orders expect [date] with
  "OrderDate" as date : date
  Quantity : number

Day.X = sum(Orders.Quantity)

show linechart "Daily" with Day.X
It is also possible to have multiple lines on the same linechart:
keep span date = [date(2021, 5, 1) .. date(2021, 7, 30)]

Day.X = random.poisson(5 into Day)
Day.Y = random.uniform(1 into Day, 10 into Day)

show linechart "Daily" with Day.X, Day.Y
linechart, advance example
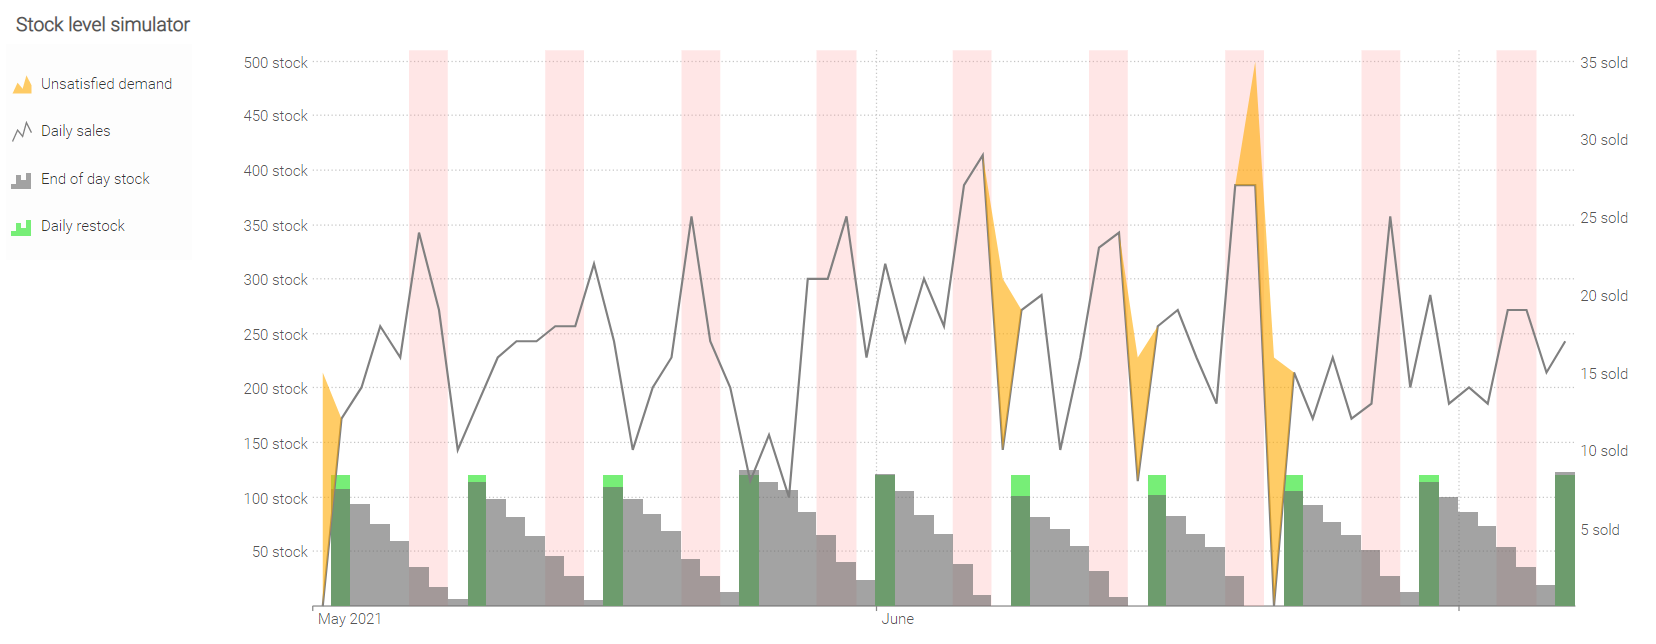
In this example, the axes respectively used for stock quantities and for sales quantities get different scales. This improves the readability of the linechart by limiting the degree of visual overlap between the time-series on display.
keep span date = [date(2021, 5, 3) .. date(2021, 7,6)]

def pure isTuesday(d : date) with
  return d == monday(d) + 1
def pure isWeekend(d: date) with
  return d >= monday(d) + 5

// Flat replenishments of 120 units on Tuesdays.
Day.Restock = if not(isTuesday(date)) then 0 else 120

// Simulating a random demand that increases on the weekend.
Day.Demand = random.ranvar(poisson(15 into Day))
Day.Demand = if isWeekend(date) then floor(Day.Demand * 1.2 + 5) else Day.Demand

// Positive cumulative sum to prevent negative stock.
def process positiveCumsum(n : number) with
  keep sum = 0
  sum = max(0, sum + n)
  return sum

Day.Stock = positiveCumsum(Day.Restock - Day.Demand) scan date
Day.Sales = Day.Stock[-1] - Day.Stock + Day.Restock

show linechart "Stock level simulator" { legendPosition: left ; vaxis { left { axisMax: 500 } } } with
  Day.Restock as "Daily restock" { seriesType: bar ; unit: " stock" ; color:#7e7 }
  Day.Stock as "End of day stock" { seriesType: bar ; seriesOpacity: 0.6; unit: " stock" ; color:#666 }
  Day.Sales as "Daily sales" { seriesType: line ; color: gray ; seriesStack:"stackSales" ; unit: " sold" }
  Day.Demand - Day.Sales as "Unsatisfied demand" { seriesType: area ; seriesOpacity: 0.6 ; seriesStack:"stackSales" ; unit:" sold"; color:#fa0 }
  if isWeekend(date) then 1 else 0 { seriesType: background ; seriesLegend: hidden ; seriesOpacity: 0.25 ; color: #f99 }
  group by date
StyleCode
For generic StyleCode rules, see stylecode.