A first pricing strategy
Lokad is both a data visualization engine and a data processing engine. This tutorial is a step-by-step guide aimed at helping you produce your first dashboard and your first pricing strategy with Lokad.
- 0. Opening your Lokad account
- 1. Uploading files
- 2. Your first project
- 3. Plotting your historical sales
- 4. Running your first project
- 5. Your first dashboard
- 6. Content of the flat files
- 7. First pricing strategy
- 8. A more elaborate dashboard with pricing results
0. Opening your Lokad account
In order to get started with Lokad, you first need a Lokad account in case you don’t already have one. Register here. In the following tutorial, we assume that you’re already logged into your Lokad account.
1. Uploading files
Lokad cannot operate without data. In order to produce meaningful data analysis, Lokad typically needs your product catalog and sales history, that is, the list of your items and the list of your orders, both files to be provided as flat files. The details regarding Lokad’s input file format go beyond the scope of this tutorial. Here, we are going to use Lokad’s sample files.
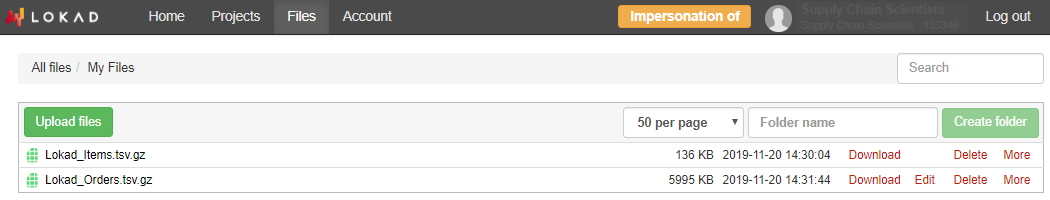
In your Lokad account, click on Files in the top navigation bar. The BigFiles app is bundled with your Lokad account, and serves as an internal file hosting service. Then, using the Create folder button, create a folder named priceforge and upload the 2 sample files. The priceforge folder is not strictly required, but creating this folder helps to keep things organized within your account.
Gotcha: the file format described here is compatible with the file format of Lokad’s forecasting engine. If you have already managed to format your data for inventory forecasting, you can use the very same files for pricing optimization.
2. Your first project
Now that you’re done uploading your files, click on Projects in the top navigation bar. The first screen that you see is a sample report. Click the “All Projects” link above this report to navigate towards the list of projects.
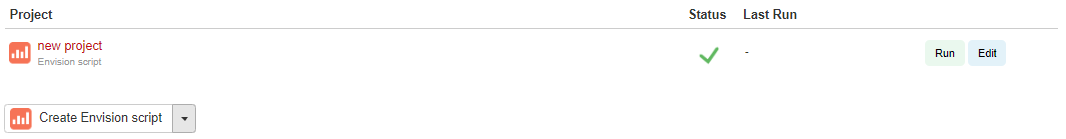
Click on Create a New Project and then click on edit next to the newly created project.
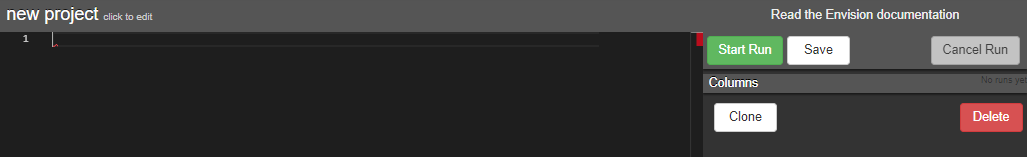
Your initial project contains only a big blank area. This area is intended to contain a script, that is, a piece of text written in a programming language that will generate your dashboard. The language used by Lokad is named Envision and this language is a lot simpler than a generic programming language. Envision comes with a syntax inspired by the formulas used in Microsoft Excel. It does not take to be a software developer to be able to use Envision, but a familiarity with Microsoft Excel will help a lot.
3. Plotting your historical sales
When you start writing your script in the text area, you will notice that various suggestions are provided as you type. Lokad’s code editor includes a rather extensive auto-completion system, which will become very handy later on as you get more familiar with Envision.
Let’s write our first script. In order to facilitate the cut-and-paste, we are also including the script below.
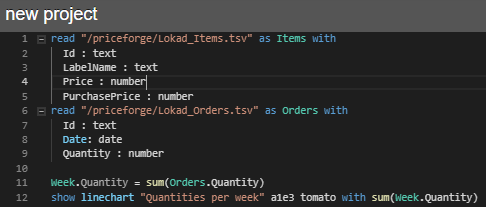
read "/priceforge/Lokad_Items.csv" as Items with
  Id : text
  LabelName : text
  Price : number
  PurchasePrice : number
read "/priceforge/Lokad_Orders.csv" as Orders with
  Id : text
  Date: date
  Quantity : number

Week.Quantity = sum(Orders.Quantity)
show linechart "Quantities per week" a1e3 tomato with sum(Week.Quantity)
The first line simply instructs Lokad to load the Items and Orders data from the /priceforge folder.
The Orders in the second line refers to the Lokad_Orders file. Had the file been named Lokad_Sales instead, Orders would have been named as Sales. Lokad is inferring variable names based on both the file names and the column names within the files. In the first line, we aggregate the sales as weekly quantities.
In the second line, we create a linechart, that is, a special tile that contains a time-series. The tile spreads from cell A1 to cell E3 following the conventions of Microsoft Excel. The foreground color of the cell is tomato. Finally, we indicate that the line chart should contain the values of sum(Week.Quantity).
4. Running your first project
Now that you’ve entered your first script, you can run this script by clicking the run button.
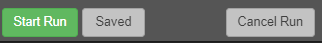
The button turns into a running label. Once the run is complete, a new Run completed entry appears. You can click on this entry to see the resulting report.
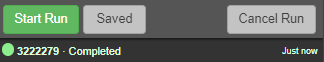
The duration of a run depends on the size of the data. With the sample data set, the run is expected to take about 10 seconds.
5. Your first dashboard
Click on the Completed run green link. It brings you to the dashboard page.
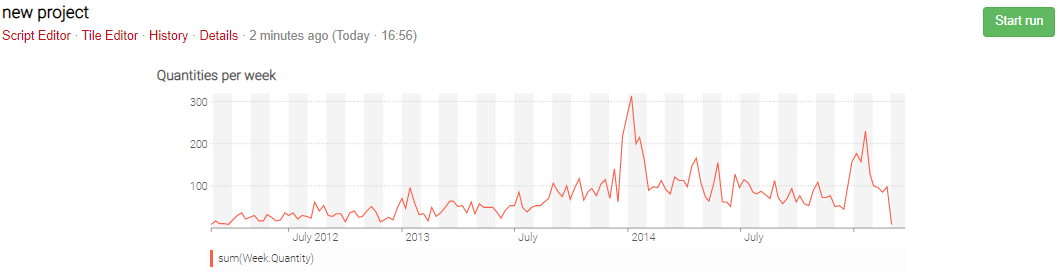
The page contains a single tile: the line chart that we have previously defined in our 2-line script. Click on the tile, and the tile is expanded to take advantage of all the space available in your browser window. Click again, and the tile goes back to its initial position.
6. Content of the flat files
From the dashboard, click on new project (edit) in the breadcrumb above the line chart in order to return to the project editor.
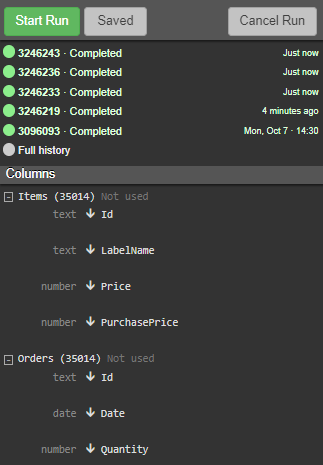
Now we see that on the left sidebar there is the list of files discovered by Lokad within the target folder in BigFiles. You can click on the elements to expand them. Each sub-list gives the list of columns discovered by Lokad in the file itself.
7. First pricing strategy
Let’s edit the script further and write our first pricing strategy. Within the text area of the project editor, enter the script as illustrated below. Don’t hesitate to cut-and-paste to speed up the process.
read "/priceforge/Lokad_Items.csv" as Items with
  Id : text
  LabelName : text
  Price : number
  PurchasePrice : number
read "/priceforge/Lokad_Orders.csv" as Orders with
  Id : text
  Date: date
  Quantity : number
Week.Quantity = sum(Orders.Quantity)
show linechart "Quantities per week" a1e3 tomato with sum(Week.Quantity)

SellPrice = PurchasePrice * 1.3 // cost-plus at 30%
SellPrice = round(SellPrice) - 0.01 // merchant rounding 0.99
show table "Sample items" c4e5 darkorange with Id, LabelName, SellPrice order by LabelName
We have added 4 lines to the script. Using lines 5 and 6, we compute a new price for each item. First, we start by adding a 30% margin on top of the purchase price. Second, we round off the prices to the next dollar, and we subtract one cent to produce nice looking commercial prices like $1.99.
On line 7, we add another tile to the dashboard with a file export named prices.tsv that contains two columns: id and the newly computed SellPrice. On line 8, we add another tile - a table - that will allow us to have a quick look at the price values we’ve just computed.
8. A more elaborate dashboard with pricing results
Click on the Run button again. Wait a few seconds for the run to complete and then click on the new green Completed run entry.
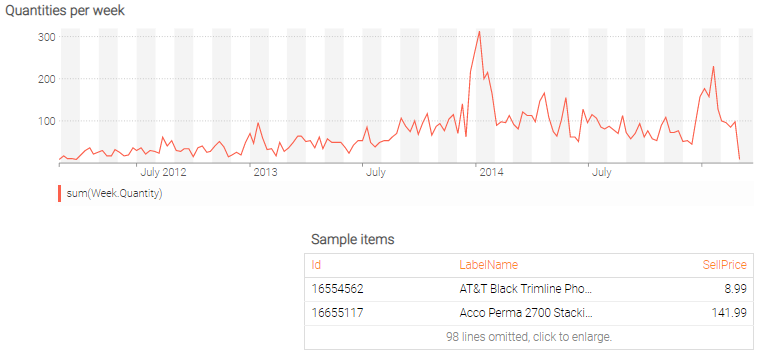
The dashboard now includes 2 tiles. The table tile, on the bottom right, illustrates a couple of new prices. As expected, prices end with 99 cents.