Workshop #2: Sales Analysis
This workshop is intended for Master students willing to learn more about Supply Chain Optimization. This second workshop will be tackling the topic of sales and customers. Starting with a generic overview of usual sales KPIs (key performance indicators) to get a grasp of the company’s activities, we will then dive into the identification of influencing factors to challenge our first naive analysis. Finally, the use of supply chain quantitative tools will be carried out to push the sales analysis even further. The workshop should take between 5 to 10 hours.

Table of contents
Introduction
Company overview
CM is a fictitious European company selling outdoor clothing with retail stores in three countries: Germany, France, and Italy. CM also has a strong online presence. The company’s website offers customers the ability to purchase their products online, with home delivery available for added convenience. In addition to their website, CM also sells their products through various online platforms, such as Amazon and other e-commerce marketplaces. This allows CM to reach a wider audience and connect with customers who prefer to shop online.
The company was founded by a group of friends who were passionate about the outdoors and wanted to make quality outdoor clothing and sporting equipment more accessible to everyone.
The first store opened in Germany, and it was an instant success. The store was filled with high-quality outdoor clothing and equipment that was both stylish and functional. The founders of CM believe that people should be able to enjoy the outdoors without sacrificing style or comfort.
CM quickly expanded to other European countries, opening stores in France, and Italy. Each store has a unique style and atmosphere that reflects the local culture and environment. The stores are more than just retail spaces; they are community hubs where outdoor enthusiasts can come together to share their passion for adventure.
Customers and Sales channels
Now that CM has made their way into the sportswear selling industry, the founders would like to carry out a more in-depth analysis of their sales to identify bottlenecks and areas of improvement. Notably, CM’s popularity and turnover has been gradually increasing every year since its creation, but the founders think that it is time to expand the company’s market share.
CM’s customers are amateur and intermediate level athletes. The usual average order value is thus moderate; however, they sometimes experience periods of higher sales (during promotional events, etc.). Following the struggles CM encountered with their suppliers due to delays in deliveries, the company is periodically experiencing stock outs on various SKUs.
To attract a wider range of customers and reach their new quarterly targets, CM’s owners are looking into analyzing their current sales data to sort out their catalog, assess the profitability of their products and start improving their most critical products.
Although CM’s sales activity started in their retail store only, a substantial part of CM’s sales is now made through their online sales channels (Amazon, store website, other platforms). CM would like to have a better understanding of their sales breakdown by channel to be able to put the necessary resources into developing their online presence.
Objectives of the workshop
The objective of this session is to pinpoint and understand the influence of various factors (economical, logistics…) on CM’s sales:
- What is the trend of CM’s sales?
- What is the profile of CM’s best sellers? Is CM dependent on some sales channels?
- Which data, which KPIs are relevant to emphasize the evolution of CM’s sales activity?
- Which factors should be considered to accurately model CM’s sales?
The workshop is structured in 3 parts:
- We start with a general overview of the CM’s sales activities.
- Then, we challenge this first approach and refine our analysis with new KPIs and influencing factors.
- We ultimately introduce quantitative supply-chain notions to overcome the limitations of average analysis.
Useful definitions :
- Sales margin: measures how much profit is generated by a sale. It is defined as
SellPrice–BuyPrice. TheBuyPriceshould include all costs (transportation, stock, etc.). - Gross Margin: measures the profitability of the company. It is the sum of the sales margins.
- Turnover: measures the volume of sales for the company. It is the sum of the sales net amounts.
- Stock out: an item is considered in stock out when its stock level is not sufficient to serve all sales. There are many definitions of Stock-out periods: in this workshop we will consider an item to be in stock-out when its stock is 0.
- Standard deviation: the average amount of variability in your dataset. It tells you, on average, how far each value lies from the mean. The higher the standard deviation is, the more the values are far from the mean.
- LokadNetAmount: the total sales amount generated for each row in
Orderstable. It is the product of quantity sold and sell price.
Additional information :
The cost of a unit in stock for CM is not limited to its buy price: other fees like transportation and stocking costs are to be taken into account. The annual stocking cost is 22% of the BuyPrice per unit for a given item. The transportation cost is 0.05€ per unit from supplier to Paris and 0.1€ by unit from supplier to both Berlin and Milan.
Dataset
The dataset provided for this workshop consists from 5 tables (see the data schema below). They are preloaded in the Envision playground (see lines of code #3 to #71).
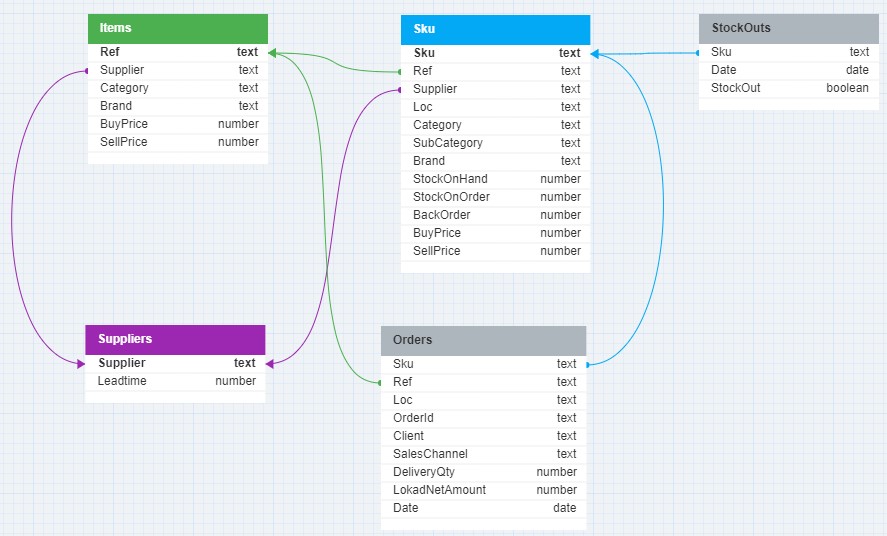
In this schema, blue, green and lilac arrows are indicating the relationships between the tables, specifically the foreign key to primary key relationships. These relationships are essential for joining tables in a relational database to query data across different entities.
For example, the Sku table, which stores information about stock keeping units, is a central table with relationships to the StockOuts and Orders tables through their foreign keys, as indicated by the blue arrows. This implies that the .Sku field in these tables references the primary key in the Sku table, allowing for a relational link between the data in these different tables.
The arrow lines start from the foreign key side with the arrowheads pointing towards the primary key side, which is a typical way to denote the direction of the relationship from the foreign key in one table to the primary key in another.
1. Suppliers Table (Suppliers.tsv)
- Purpose: Contains information about the suppliers of CM.
- Contents: Includes each supplier’s name and the lead time for deliveries.
- Key Fields:
Supplier(Primary Key),Leadtime.
2. Items Table (Catalog.tsv)
- Purpose: Details each item sold by CM.
- Contents: Includes item reference, category, supplier, brand, and both buying and selling prices.
- Key Fields:
Ref(Item Reference),Category,Supplier,Brand,BuyPrice,SellPrice.
3. SKU Table (SKU.tsv)
- Purpose: Provides detailed information about each Stock Keeping Unit (SKU) in CM’s inventory.
- Contents: Includes SKU reference, location, category, subcategory, brand, supplier, stock levels, and pricing.
- Key Fields:
Sku,Loc,Ref,Category,SubCategory,Brand,Supplier,StockOnHand,StockOnOrder,BackOrder,BuyPrice,SellPrice.
4. Orders Table (Orders.tsv.gz)
- Purpose: Records all sales transactions made by CM.
- Contents: Includes details of each order such as date, SKU, location, quantity, net amount, order ID, client, and sales channel.
- Key Fields:
Sku,Date,Ref,Loc,DeliveryQty,LokadNetAmount,OrderId,Client,SalesChannel.
5. StockOuts Table (StockOuts.tsv.gz)
- Purpose: Tracks instances of stock unavailability at CM.
- Contents: Records dates when specific SKUs were out of stock.
- Key Fields:
Sku,date,StockOut.
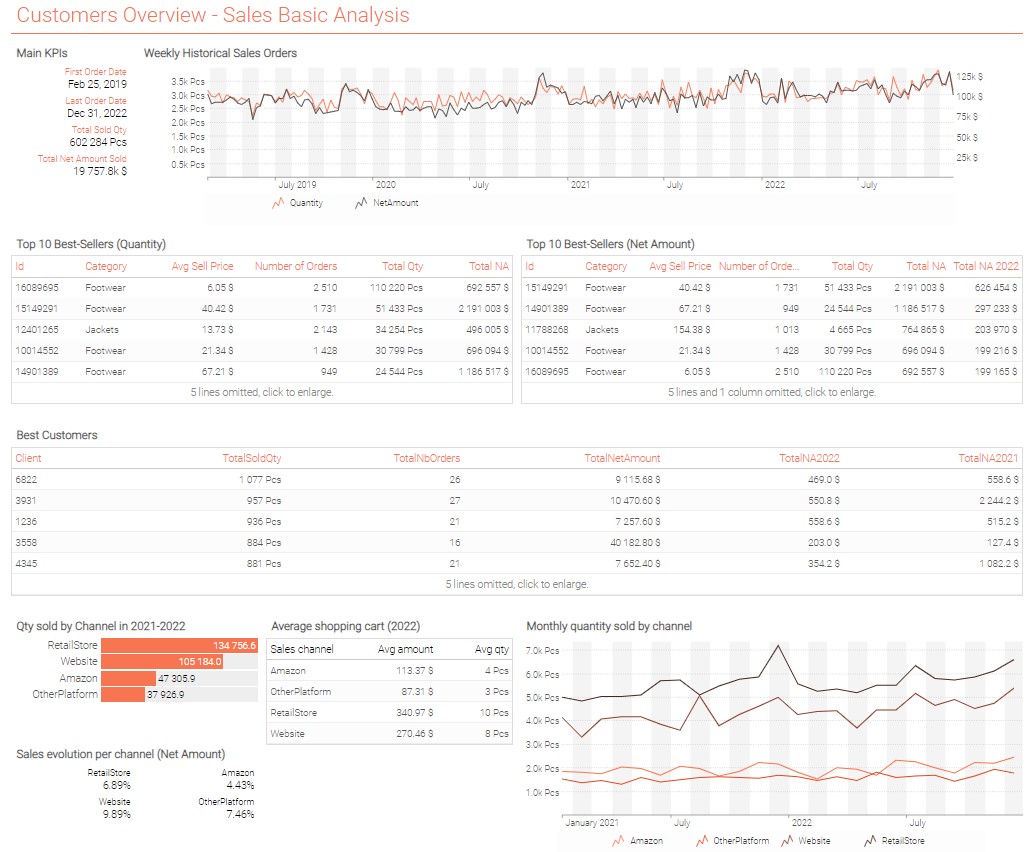
Part 1: Customers Overview – Sales Basic Analysis
Questions
a. Orders of Magnitude
- Display the following information in a summary tile:
First Order Date,Last Order Date,Total Sold Quantity,Total Net Amount Sold.
b. Sales History
- Display historical sales order quantities and net amounts at weekly granularity in a linechart.
Hint: necessary aggregation can be done using group by together with monday or week functions, but also by performing straight weekly aggregation.
- What is the best period of sales for the company within a year?
c. Best Sellers
Overview by Net Amount
- Display the following information in a table tile for the 10 best-selling items (in net amount) at item level:
Id,Total Number of Orders,Total Quantity,Total Net Amount,Net Amount for year 2022,Net amount for year 2021,Category,Average Sell Price.
Hint: order the table by Total Net Amount in descending order, then have a look at the documentation on distinct, avg and rank().
- Which item is the best-seller for the company and what category does it belong to?
Overview by Quantity
-
Display the following information in a
tabletile for the 10 best-selling items (in quantity) at item level:Id,Total Number of Orders,Total Quantity,Total Net Amount,Category,Average Sell Price. Order the table byTotal Quantityin descending order. -
What can be observed about Ids
13751180and15063964in the two previous tables?
d. Best Customers
- Display the following information in a
tabletile for the top 10 customers (by quantity purchased):total number of orders,total quantity,total net amount,net amount for year 2022,net amount for year 2021. Order the table bytotal quantityin descending order.
Hint: create Clients table to carry your calculations at aggregated customer level. See line #119 where the table creation statement is provided and understand how by statement works. Continue writing the code from there. You might need to check documentation for aggregators same, distinct, sum, year function and rank() scan process.
- Looking at the different values in the previous
tabletile, is there an indicator that seems more relevant to establish a list of the best customers?
e. Sales by Channel
- Display the total quantity sold by sales channel in 2021 and 2022 in a barchart.
Hint: you may create a table SalesChannels with one row per sales channel in the same way the Clients table was created. An aggregator single might be useful as well.
-
Display on a
linecharttile the quantity sold by month in 2021 and 2022 for each sales channel. -
Display a
tabletile containing the following information at sales channel level:channel,average amount of an order,average quantity of products in an order(rounded to the closest integer). Consider only orders in 2022. -
Display a
summarytile with the evolution of sales amount (%) for each channel between 2021 and 2022. -
CM’s marketing team would like to conduct a promotional campaign for their best sellers on one of their sales channels. Which channel do you deem would be the best candidate and why?
Conclusions
Trend
CM sales are on a steady positive trend which legitimates the constant increase of their purchases observed in Workshop #1. Be it in terms of sales quantities or sales net amount, this rising trend appears in all categories and all sales channels.
Sales profiles
Most of CM’s sales (in quantities) rely on 10% of their catalog. CM’s most critical category of references is “Footwear”. Among CM’s best sellers however, “Jackets” and “Climbing” categories references are proportionately represented. A focus on a single category to analyze CM’s sales is thus to be excluded.
References sales can be split into two types of profiles: high quantities and high net amounts. Therefore, products called “critical” cannot be considered based on the same KPIs. Likewise, customers buying large quantities of references might not generate the highest turnover for CM. It is important to conduct more in-depth analysis, considering margins and revenue, to introduce profitability indicators.
Sales channels
The sales channels with the highest activity (in terms of quantities sold) are CM’s retail store and website. Customers tend to buy more products on those channels. Even though the other platform channel has the lowest activity, its trend is steeper than Amazon sales trend, and closest to CM’s best sales channels. A marketing campaign to boost sales and general activity on Amazon could be an option to consider.
Hint: To check yourself here is an example of a dashboard that you might built. The exact layout of the dashboard and colors might be different depending on your choices.
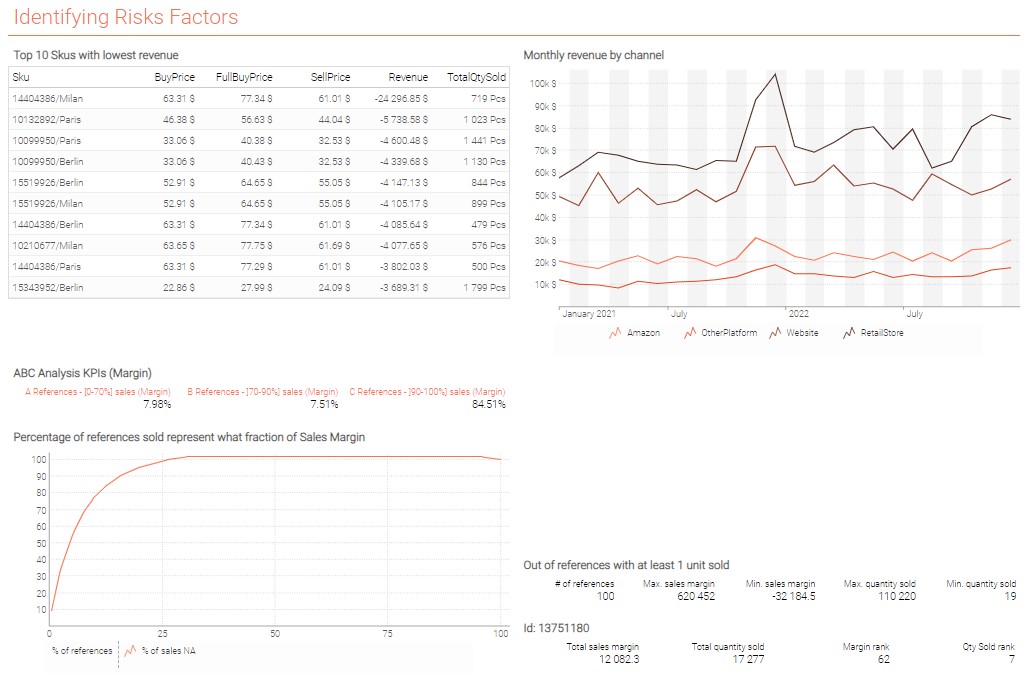
Part 2: Identifying Risks Factors
a. Margins Analysis
-
Calculate the
FullBuyPriceof each SKU in theSKUtable, using the information provided about SKUs cost. Consider that FullBuyPrice = BuyPrice + 1year stocking cost + transportation cost. -
For the 10 SKUs (which have been sold at least once) with the lowest revenue, display a table containing the following information:
SKU,BuyPrice,FullBuyPrice,SellPrice,Revenueandtotal quantity soldat SKU level. Order the table from lowest to highest revenue. -
Display on a
linecharttile therevenue by monthin 2021 and 2022 for each Sales Channel. Which channel is the most profitable?
b. ABC Analysis on economic values (Pareto)
-
In a
summarytile, display the three following information: percentage of references betweenclass A(<= 70% of the overall Sales Margin),class B(> 70% and <= 90%) andclass C(> 90%). -
Display in a plot tile the percentage of references sold by percentage of sales margins.
-
For references with at least one unit sold ever, display in a
summarytile:Quantity of References,Highest Total Sales Margin,Lowest Total Sales Margin,Highest Quantity Sold,Lowest Quantity Sold. -
For a reference
13751180, display in asummarytile:Total Sales Margin,Total Sold Quantity,Rank by Sales Margin,Rank by Quantity Sold(rank 1 being attributed to the reference with the highest value). What is noticeable about this reference? What is the use of keeping such a reference in the catalog?
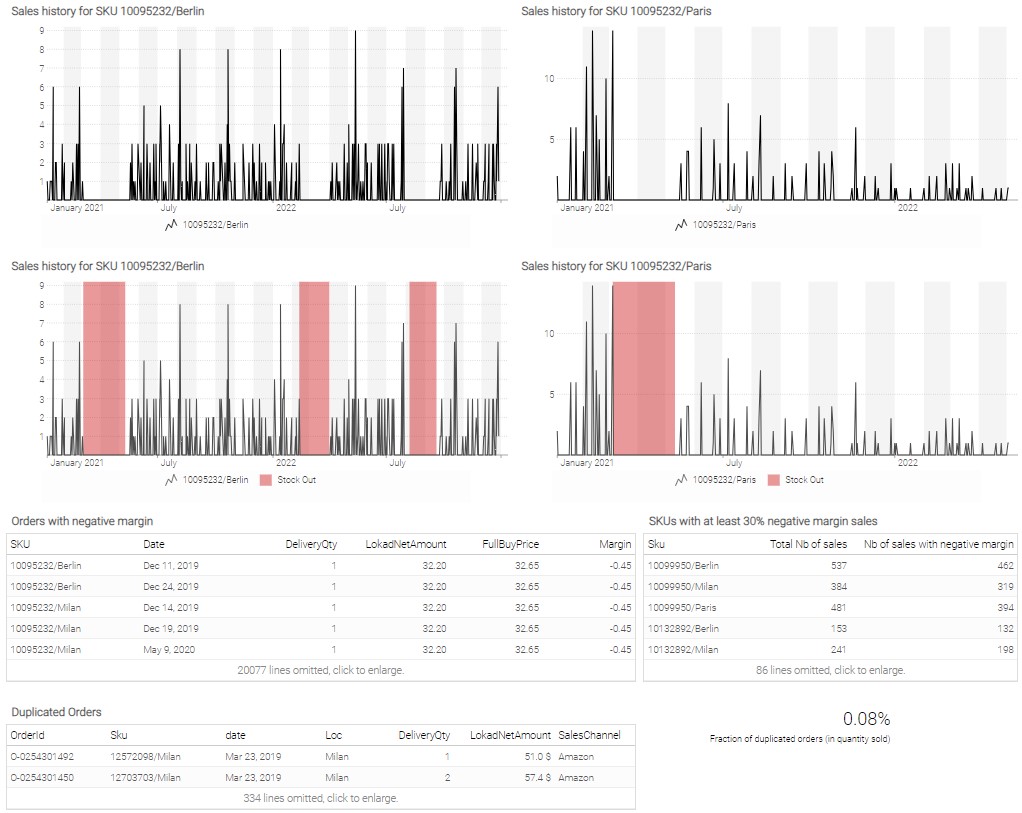
c. Stock-Out Periods
-
Create table
SKUsDaythat contains one row for each SKU for each day. Use cross operation forSKUandDaytables. Create a columnQtySoldcontaining the aggregated quantity sold each day for each SKU. -
In a
linechartat day granularity, display the sales history for a SKU10095235/Berlinfor 2021 and 2022. Prolonged periods where no sales happen can be observed: what could be the cause of such periods? -
Using table
StockOutswhich contains one row for each day when a SKU has been in stock-out, add a light red background to the two previous linecharts to highlight stock out periods.
Hint: use the column StockOutAsNumber defined in the script, along with stylecode properties seriesType, color and seriesOpacity.
Can you confirm or overturn your hypothesis about the cause of zero sales periods for those SKUs?
d. Data Inconsistencies
Duplicate rows
-
In the table
Ordersfor rows having the sameOrderId,SKU,OrderDateandDeliveryQty, display the following information in a table tile:OrderId,SKU,Date,Localisation,Sales Channel,DeliveryQty,LokadNetAMount. What do these rows have in common and what can you infer from these common points? -
Display the fraction of duplicated orders sold quantities compared to the overall sold quantity.
Negative margins
-
For
Orderstable rows with a negative margin, display atabletile containing the following information:SKU,Date,DeliveryQty,LokadNetAmount,FullBuyPrice,Margin. Order the table by SKU. -
Display the list of all SKUs that have at least 30% of their sales with negative margins, along with their total number of sales and their number of sales with negative margin.
-
What kind of scenario can justify a SKU with negative margins sales?
Conclusions
Margin & Revenue
High quantity sold is not synonymous with high profitability. To better evaluate the contribution of a SKU to CM’s activities, economic indicators such as the margin and the revenue are most appropriate. However, those indicators are not sufficient to completely grasp the behavior and criticality of a SKU.
Relevance of non-economic indicators
We saw that relying solely on quantity sold is not a good factor to model sales activity. Nevertheless, some SKUs can be sold in remarkably high quantities but with low, even negative margins. Setting aside the hypothesis of errors in the data, there are reasons to keep proposing such SKUs in a catalog. Indeed, those SKUs are necessary to initially attract the customers and showcase the rest of the catalog, potentially getting clients to purchase more profitable SKUs. Thus, the sole margin/revenue indicator is not sufficient either: mixing economic and quantitative KPIs provides a more global view of sales.
Stock outs
Revenue and quantity sold cannot be relied on as such to model a reference’s sales: those values must be put into perspective with SKUs’ availability in stock. Lower sales during a given period are not necessarily the consequence of lower activity or lower customers’ interest: it might be a result of poorly managed supply chains or suppliers’ exceptional unavailability. It is consequently of major importance to acknowledge stock out periods when analyzing sales data.
Data inconsistencies
Besides process and management issues, data issues are also responsible for biases in sales KPIs and must be investigated. This actually constitutes an important part of the work of any data analyst: data is bound to contain errors and should not be deemed 100% accurate.
Hint: To check yourself here is an example of a dashboard that you might built. The exact layout of the dashboard and colors might be different depending on your choices.
Part 3: Limitations and In-Depth Observations
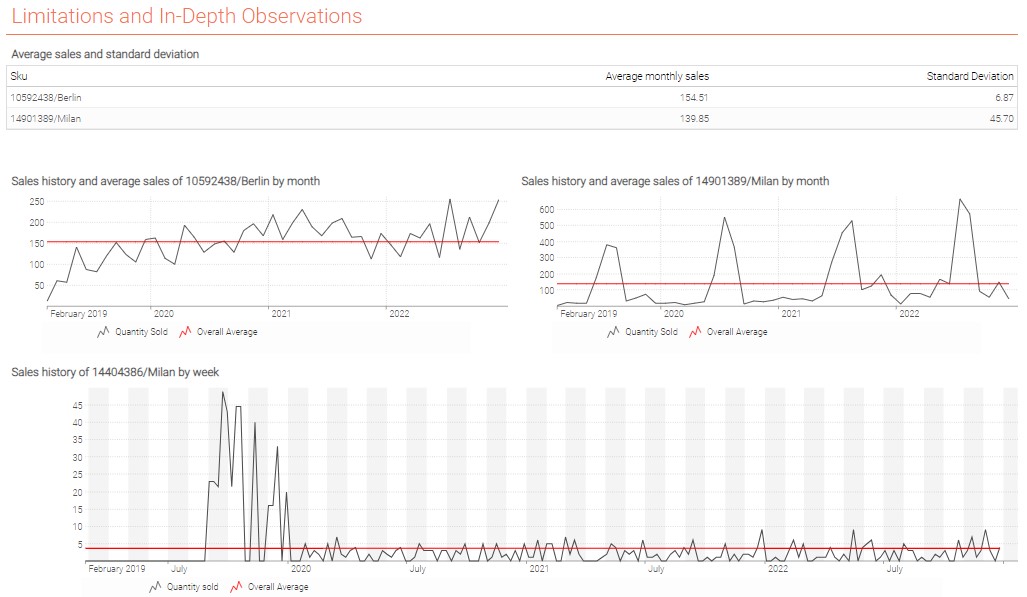
a. Average Sales Analysis
- In a
tabletile, display the following information for SKUs14901389/Milanand10592438/Berlin:SKU,average monthly quantity sold,overall standard deviation.
Hint: create the SkuMonth table to aggregate sales calculations at a monthly level. See line #121 where the table creation statement is provided and understand how cross keyword works. Continue writing the code from there. Functions avg and stdev might be useful.
-
Display the following information in a
linechartat a monthly level for both SKUs:quantity sold, andoverall average quantity sold by month. -
Looking at the tiles you have displayed in the two previous steps, explain why the sole use of the average quantity sold per SKU is not enough to infer their sales profile.
b. Exceptional events
- Display in a
linechartthe historical weekly sales and the overall average weekly quantity sold for SKU14404386/Milan.
Hint: create SkuWeek table in a same manner as you created SkuMonth table.
- Can you identify two periods with different sales profiles? What could be the cause of this behavior?
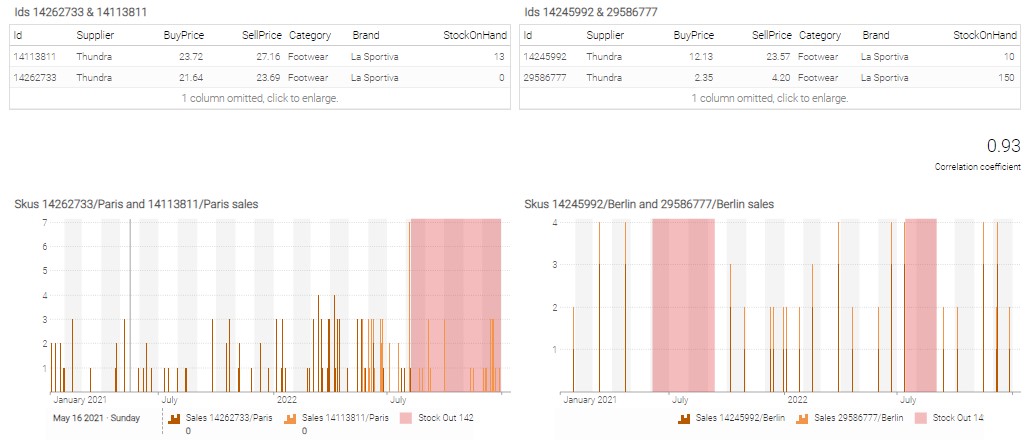
c. Case study
-
Sales of SKUs
14262733/Parisand14113811/Parisare correlated: usingItems,OrdersandStockOutsdata, give an explanation of their sales behavior. -
Same question for SKUs
14245992/Berlinand29586777/Berlin. Display also a correlation coefficient between these 2 SKUs.
Hint: use table SkusDay to calculate the correlation coefficient (there is no built-in function for this calculation).
Hint: To check yourself here is an example of a dashboard that you might built. The exact layout of the dashboard and colors might be different depending on your choices.
Conclusion of the Sales Analysis
Sales Profiles
Two products with the same volume of sales can have quite different sales profiles. Thus, product analysis cannot be conducted on the sole basis of their average sales: notions of seasonality (sales pattern depending on the period of the year), trend and exceptional events need to be introduced to define a forecasted demand for all products.
Correlation between references
Depending on the company’s activities, different products’ sales can be dependent. It is the case for products that are sold together (for instance, a shirt and its plastic bag) or new products that are replacing older products. In the case of the replacement of a SKU, if the newest SKU is expected to have the same sales behavior as the oldest one (same sell price, function, color…), the old SKU’s sales history can be used as a “virtual” sales history for the new SKU, thus increasing the number of historical data points to get a more accurate demand forecast.
Necessity of quantitative sales analysis
The main conclusion of the analysis led in this workshop is that a product’s sales behavior cannot be defined by its average demand only. Even though this information is useful, it must be coupled with other quantitative KPIs which can affect sales at separate times of a product’s lifetime. Such variations in a product’s sales should be anticipated to create a demand forecast considering all potential future events.
Annex
Get the dataset from the Envision playground
/// ## 0.1 Reading data tables
/// The list of suppliers.
read "/Suppliers.tsv" as Suppliers[Supplier] with
  /// Primary key, identifies each supplier.
  Supplier : text
  /// The delay from the order date to the delivery date, in days.
  Leadtime : number

/// The list of items, purchased and sold.
read "/Catalog.tsv" as Items[Ref] expect [Supplier] with
  /// The primary key, identifies each item.
  Ref : text
  /// Foreign key to `Suppliers`.
  Supplier : text
  /// Unit price to buy 1 unit from the supplier.
  BuyPrice : number
  /// Unit price to sell 1 unit to to a client.
  SellPrice : number
  Category : text
  Brand : text

///The list of SKUS, purchased and sold.
read "/SKU.tsv" as SKU[sku] expect[Ref,Supplier] with
  /// The primary key, identifies each sku
  "Sku" as sku : text
  /// The place where the item is stocked
  Loc : text
  /// Foreign key to `Items`.
  Ref : text
  Category : text
  SubCategory : text
  Brand : text
  Supplier : text
  ///The stock available on the shelves (in units)
  StockOnHand : number
  ///The stock currently in transfer from suppliers (in units)
  StockOnOrder : number
  ///The sales orders that need to be fulfilled (in units)
  BackOrder : number
  /// Unit price to buy 1 unit from the supplier.
  BuyPrice : number
  /// Unit price to sell 1 unit to to a client.
  SellPrice : number

///The list of past transactions, sold to customer
read "/Orders.tsv.gz" as Orders expect[sku,Ref,date] with
 // Foreign key to `SKU`.
  "Sku" as sku : text
///The date when the sales orders happened
  "OrderDate" as date : date
 // Foreign key to `Items`.
  Ref : text
  Loc : text
///The quantity delivered to the customer
  DeliveryQty : number
  LokadNetAmount : number
///The identifier of the sales transaction
  OrderId : text
///The identifier of the customer
  Client : text
///The channel used by the customer for the sales transaction
  SalesChannel : text

///The history of stock-outs which means that item was missing in a given location
read "/StockOuts.tsv.gz" as StockOuts expect[sku, date] with
 // Foreign key to `SKU`.
  "Sku" as sku : text
///The date when the stock was missing
  date : date
///If true, it means that stock was indeed missing
  StockOut : boolean

/// ## 0.2 Introduction
show label "Sales Analysis" a1g1 {textAlign: center ; textBold: "true"}
show markdown "Generic Documentation" a2g2 with """
  Hi there, welcome to your second Envision exercise! Here, you will do a sales analysis.
  You'll start by a basic analysis and draw first conclusions and limits of a
  classic approach. You'll then discover some advanced concepts of the Quantitative Supply Chain!
  """
/// ## 0.3 Displaying raw Data tables

show table "Suppliers" a3b3 with
  Suppliers.Leadtime as "Leadtime"
show table "Items" c3d3 with
  Items.Supplier as "Supplier"
  Items.BuyPrice as "BuyPrice"
  Items.SellPrice as "SellPrice"
  Items.Category as "Category"
  Items.Brand as "Brand"
show table "SKU" e3f3 with
  SKU.Supplier as "Supplier"
  SKU.Ref as "Ref"
  SKU.Loc as "Loc"
  SKU.Category as "Category"
  SKU.SubCategory as "SubCategory"
  SKU.Brand as "Brand"
  SKU.StockOnHand as "StockOnHand"
  SKU.StockOnOrder as "StockOnOrder"
  SKU.BackOrder as "BackOrder"
  SKU.BuyPrice as "BuyPrice"
  SKU.SellPrice as "SellPrice"
show table "Orders" a4b4 with
  date as "date"
  Orders.Ref as "Ref"
  sku as "SKU"
  Orders.Loc as "Loc"
  Orders.DeliveryQty as "DeliveryQty"
  Orders.LokadNetAmount as "LokadNetAmount"
  Orders.OrderId as "OrderId"
  Orders.Client as "Client"
  Orders.SalesChannel as "SalesChannel"
show table "StockOuts" c4d4 with
  StockOuts.date as "date"
  sku as "SKU"
  StockOuts.StockOut as "StockOut"

////0.4 ---- Coding Tips///

table Clients = by Orders.Client

table SkuMonth max 100k = cross(SKU,Month)

/// ## 0.5 Documentation
/// The public Envision documentation is available here: https://docs.lokad.com/"