Economic purchase prioritization
Probabilistic forecasts provide much more fine-grained insights about the future compared to more traditional forecasting approaches, and incite us to re-think the entire ordering process. In this section, we detail how a purchase priority list can be generated using Lokad. The two key benefits of this approach in comparison with reorder points are: no more service levels to maintain and fine-tune, and a more flexible purchasing methodology that better accommodates supply constraints.
The purchase priority list is an example of a prioritized ordering policy for inventory. This broad class of inventory policies delivers superior inventory performance compared to traditional inventory policies. Whenever applicable, Lokad recommends to use a prioritized ordering policy.
Table of contents
Script template for the priority list
In order to generate a priority list, we need to use a small Envision script (see below). This script can be created in your Lokad account via the button Create Envision script. Once the new project is created, you will be presented with a source code editor. Copy the code below and click Save.
read form with
budget : number
read "/sample/Lokad_Items.tsv" as Items[id] max 1m with
"Id" as id : text
Supplier: text
Category: text
SubCategory: text
SellPrice : number
BuyPrice : number
StockOnHand : number
StockOnOrder : number
Backorder : number
LotMultiplier : number
read "/sample/Lokad_Orders.tsv" as Orders max 1m expect [id, date] with
"Id" as id : text
"Date" as date : date
Quantity : number
read "/sample/Lokad_PurchaseOrders.tsv" as PO max 1m expect [id, date] with
"Id" as id : text
"Date" as date : date
DeliveryDate : date
orderingLeadtime = 7 // 7 days
// exclude non-delivered POs
where PO.DeliveryDate > PO.date
Items.Leadtime = forecast.leadtime(
hierarchy: (Items.Category, Items.SubCategory),
present: (max(Orders.date) by 1 + 1),
leadtimeDate: PO.date,
leadtimeValue: PO.DeliveryDate - PO.date + 1)
Items.Demand = forecast.demand(
horizon: Items.Leadtime + dirac(orderingLeadtime),
hierarchy: (Items.Category, Items.SubCategory),
present: (max(Orders.date) by 1) + 1,
demandDate: Orders.date,
demandValue: Orders.Quantity)
show form "Purchase simulator" a1b3 tomato with
budget as "Max budget"
Items.M = Items.SellPrice - Items.BuyPrice
// stock-out penalty
Items.S = - 0.25 * Items.SellPrice
// % '0.3' as annual carrying cost
Items.C = - 0.3 * Items.BuyPrice * mean(Items.Leadtime) / 365
// back-order case
Items.MB = 0.5 * Items.SellPrice
Items.MBU = Items.MB * uniform(1, Items.Backorder)
// back-order case
Items.SB = 0.5 * Items.SellPrice
Items.SBU = Items.SB * uniform(1, Items.Backorder)
// opportunity to buy later
Items.AM = 0.3
// % '0.2' as annual economic discount
Items.AC = 1 - 0.2 * mean(Items.Leadtime) / 365
Items.RM = Items.MBU + shift((stockrwd.m(Items.Demand, Items.AM) * Items.M), Items.Backorder)
Items.RS = Items.SBU + shift(zoz(stockrwd.s(Items.Demand) * Items.S), Items.Backorder)
Items.RC = shift((stockrwd.c(Items.Demand, Items.AC) * Items.C), Items.Backorder)
// plain recomposition
Items.R = Items.RM + Items.RS + Items.RC
Items.Stock = Items.StockOnHand + Items.StockOnOrder
Items.DBO = Items.Demand + Items.Backorder
table G max 100k = extend.ranvar(Items.DBO, Items.Stock, Items.LotMultiplier)
where G.Max > Items.Stock
G.Q = G.Max - G.Min + 1
// integral of the stock reward function
G.Reward = int(Items.R, G.Min, G.Max)
G.Score = G.Reward / max(1, Items.BuyPrice * G.Q)
// top scores first
// but preserve ordering of pairs (Id, G.Max)
G.Rank = rank(G.Score, id, -G.Max)
G.Invest = cumsum(Items.BuyPrice * G.Q) scan [G.Rank]
where G.Invest < budget
where any(G.Q > 0) into Items
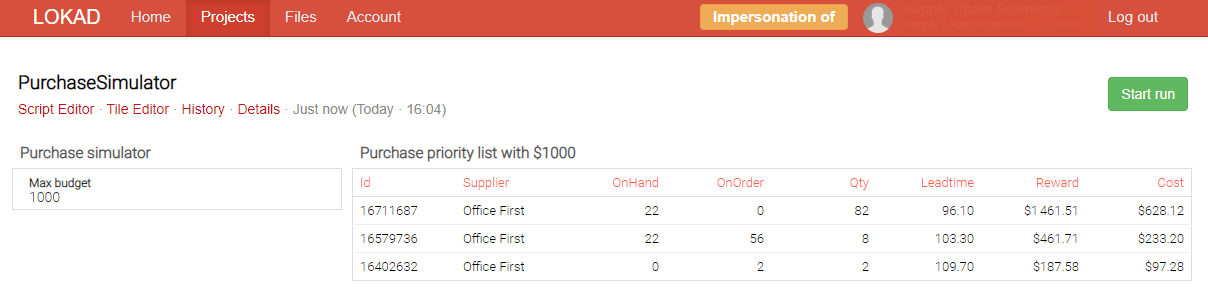
show table "Purchase priority list with $\{budget}" c1g3 tomato with
id as "id"
Items.Supplier as "Supplier"
Items.StockOnHand as "OnHand"
Items.StockOnOrder as "OnOrder"
sum(G.Q) as "Qty"
mean(Items.Leadtime) as "Leadtime"
sum(G.Reward) as "Reward" {unit:"$"}
sum(Items.BuyPrice * G.Q) as "Cost" {unit:"$"}
group by id
order by avg(G.Score) desc
This script produces a dashboard that contains one table. A supply chain planner is expected to purchase the suggested items following the order of the list. The suggested quantities take the back orders into account, as well as the lot multipliers.
Let’s review the content of the script. The top line is reading data from the /sample folder, where the sample files are expected to be located.
Concerning the Lokad_Items.tsv file that is intended to contain the list of products or SKUs, we assume that two “special” columns are available:
SellPrice: the unit selling price (without tax)BuyPrice: the unit purchase price (without tax)
Once you have adjusted the script to make sure that it extracts data from the correct input folder, and assuming that the
SellPriceandBuyPricefields are available as expected by our technology, you can then click theRunbutton. The script is executed and produces a dashboard that contains a single large table. Click the table, at the bottom of the screen, and you will have the option to download this table as an Excel sheet.
The very top of the script includes two calls to the probabilistic forecasting engine of Lokad, respectively to forecast leadtime and to forecast demand.
Then, we introduce the economic variables relevant to the calculation of the stock reward function:
M: the reward (gross margin) per unit serviced from the stock.S: the penalty per unit when a demand cannot be serviced from the stock.C: the per-unit annual carrying cost per unit.AM: the discount factor on the margin component.AC: the discount factor on the carrying cost component.
The core of the prioritization logic happens in the calculation of G.Reward and G.Score.
G.Reward: represents the economic rewards associatedG.Qextra units in stock (usuallyG.Qjust equals 1).G.Score: represents a ratio of the quantity of returns in dollars for every dollar invested in stock.
The where filter that follows, excludes the situations where the reorder point is below the current inventory levels. We exclude these situations because we are only considering those purchasing scenarios here whereby we aim to acquire more inventory. Within this block, we proceed with a second series of calculations that drives the prioritization itself:
G.Rank: sorts all the grid entries according to their score. However, the sorting operation comes with a twist: for every item, the new ordering preserves the reorder point’s order.G.Invest: demonstrates how to create a cumulative calculation. Here, we compute the total investment (cumulative), assuming that every item is purchased following the list order.
Finally, the script ends with a show table statement, and all the lines of the grids are aggregated by Id, in order to have a list where each item appears only once.
Refining the prioritization
The script we saw earlier makes somewhat simplistic assumptions about the economic variables used for the stock reward calculation. All your items might not be subject to the same carrying costs. Some items might be perishable, some might be very bulky, etc. You can check the section about inventory costs for more realistic assumptions regarding this type of costs. In practice, we observe that most merchants systematically under-estimate their cost of inventory. In our experience, any annualized carrying cost amounting to less than 25% is questionable.
While going through the script might seem slightly tedious at first, in practice, we have found that this is one of the few options that offers the flexibility that is required in order to implement assumptions that are aligned with your business. The Envision script offers the sort of expressiveness that you would typically find in an Excel spreadsheet.
On the profit side, the script seen previously favors a pure maximization of the gross margin. Yet, this might negatively impact your business if some lower margin items happen to drive your business by generating many smaller but much more profitable sales (for example, a client buys a smartphone with a 2.5% gross margin, followed by a purchase of two phone accessories with a 50% gross margin). In this case, you might introduce a “goodwill” factor represented by some deferred margin applied to such flagship items.