Workshop #1: Supplier Analysis
This workshop is intended for Master students willing to learn more about supply chain optimization. With this first case study, we will focus on the analysis of a company’s suppliers, guiding you from a simple and naive overview to much more in-depth observations. Critical supply chain quantitative concepts will also be approached through different questions, such as economic profitability, performance monitoring and risk management. The workshop should take between 5 and 10 hours to complete, depending on your programming skills.

Table of contents
Introduction
Persona overview
CM is a fictitious European company selling outdoor clothing with retail stores in three countries: Germany, France, and Italy. CM also has a strong online presence. The company’s website offers customers the ability to purchase their products online, with home delivery available for added convenience. In addition to their website, CM also sells their products through various online platforms, such as Amazon and other e-commerce marketplaces. This allows CM to reach a wider audience and connect with customers who prefer to shop online.
The company was founded by a group of friends who were passionate about the outdoors and wanted to make quality outdoor clothing and sporting equipment more accessible to everyone.
The first store opened in Germany, and it was an instant success. The store was filled with high-quality outdoor clothing and equipment that was both stylish and functional. The founders of CM believe that people should be able to enjoy the outdoors without sacrificing style or comfort.
CM quickly expanded to other European countries, opening stores in France, and Italy. Each store has a unique style and atmosphere that reflects the local culture and environment. The stores are more than just retail spaces; they are community hubs where outdoor enthusiasts can come together to share their passion for adventure.
Suppliers and challenges
As a European company selling outdoor clothing and sporting equipment, CM sources their products from various suppliers across the globe. CM works closely with its suppliers to ensure that the materials and manufacturing processes used to create their products meet their high standards for quality.
TalonCotex, a textile company based in Asia, is one of CM’s main suppliers. They specialize in producing high-quality fabrics that are ideal for outdoor clothing and running gear. Their fabrics are known for being breathable, moisture-wicking, making them an excellent choice for outdoor enthusiasts.
Another important supplier for CM is a sporting equipment manufacturer, Thundra, based in Europe. This company produces a range of equipment, from hiking and camping gear to skiing and snowboarding equipment. CM collaborates with this supplier to develop innovative equipment that is both functional and stylish.
CM also sources products from smaller, specialized suppliers, such as manufacturers of climbing gear or outdoor clothing. These suppliers often have a unique focus or expertise that allows CM to offer a wider range of products to their customers.
In recent months, CM has been struggling with some of their suppliers. Despite their best efforts to maintain strong relationships with their suppliers and ensure timely delivery of products, CM has been receiving incomplete shipments or shipments that arrived well after the promised delivery date.
This has caused some disruption to their supply chain and made it difficult for CM to meet the demands of their customers. Customers who had placed orders were receiving incomplete shipments, which led to frustration and dissatisfaction. Some customers even cancelled their orders altogether, which was a loss for the company.
Objectives of the workshop
The objective of this session is to identify potential risks and vulnerabilities in CM’s suppliers’ management:
- What is the global trend of CM business?
- To which extent CM is depending on certain suppliers? What profitability can CM expect from them?
- Are CM’s suppliers reliable when it comes to meeting delivery deadlines? Are there periods of the year when delivery performance is affected by external events?
- Are CM’s suppliers always providing high-quality products that meet CM’s needs and standards?
The session will be structured in 3 steps:
- We will start with a general overview of the suppliers’ situation
- We will draw conclusions from this first approach and consider the limitations of our analysis
- We will engage in even more in-depth observations
Useful definitions :
- Supplier Leadtime: The Supplier Leadtime refers to the time it takes to get a Purchase Order delivered by a Supplier. It can be defined as time between Purchase Order Order Date and Purchase Order Reception Date:
PO.DeliveryDate–PO.Date. - Margin: Measures how much profit is generated by a sale. It is defined as
SellPrice–BuyPrice.
Dataset
The dataset provided for this workshop consists from 3 tables (see the data schema below). They are preloaded in the Envision playground (see lines of code #4 to #41).
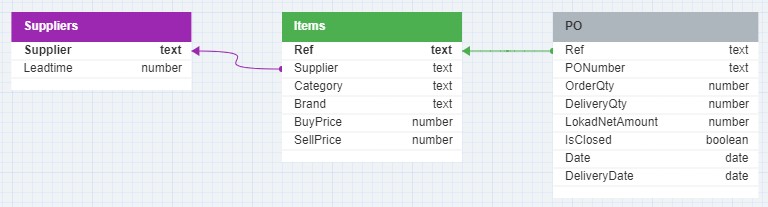
In this schema, lilac and green arrows are indicating the relationships between the tables, specifically the foreign key to primary key relationships. These relationships are essential for joining tables in a relational database to query data across different entities.
For example, the Items table, which stores information about CM’s catalogue, is a central table with relationship to the Suppliers table through its foreign key, as indicated by the lilac arrow, but also with relationship to the Purchase Orders (PO) table through its primary key, as indicated by the green arrow.
The arrow lines start from the foreign key side with the arrowheads pointing towards the primary key side, which is a typical way to denote the direction of the relationship from the foreign key in one table to the primary key in another.
1. Suppliers Table (Suppliers.tsv)
- Purpose: Contains information about the suppliers of CM.
- Contents: Includes each supplier’s name and the lead time for deliveries.
- Key Fields:
Supplier(Primary Key),Leadtime.
2. Items Table (Catalog.tsv)
- Purpose: Details each item sold by CM.
- Contents: Includes item reference, supplier, category, brand, and both buying and selling prices.
- Key Fields:
Ref(Item Reference - Primary Key),Supplier,Category,Brand,BuyPrice,SellPrice.
3. PO Table (PO.tsv)
- Purpose: Tracks purchase orders for external supplier orders.
- Contents: Features item reference, PO number, order and delivery quantities, net amount, closure status, order date, delivery date.
- Key Fields:
Ref(Item Reference),PONumber,OrderQty,DeliveryQty,LokadNetAmount,IsClosed,Date,DeliveryDate.
Part 1: Suppliers Overview – Basic Analysis
1. Questions
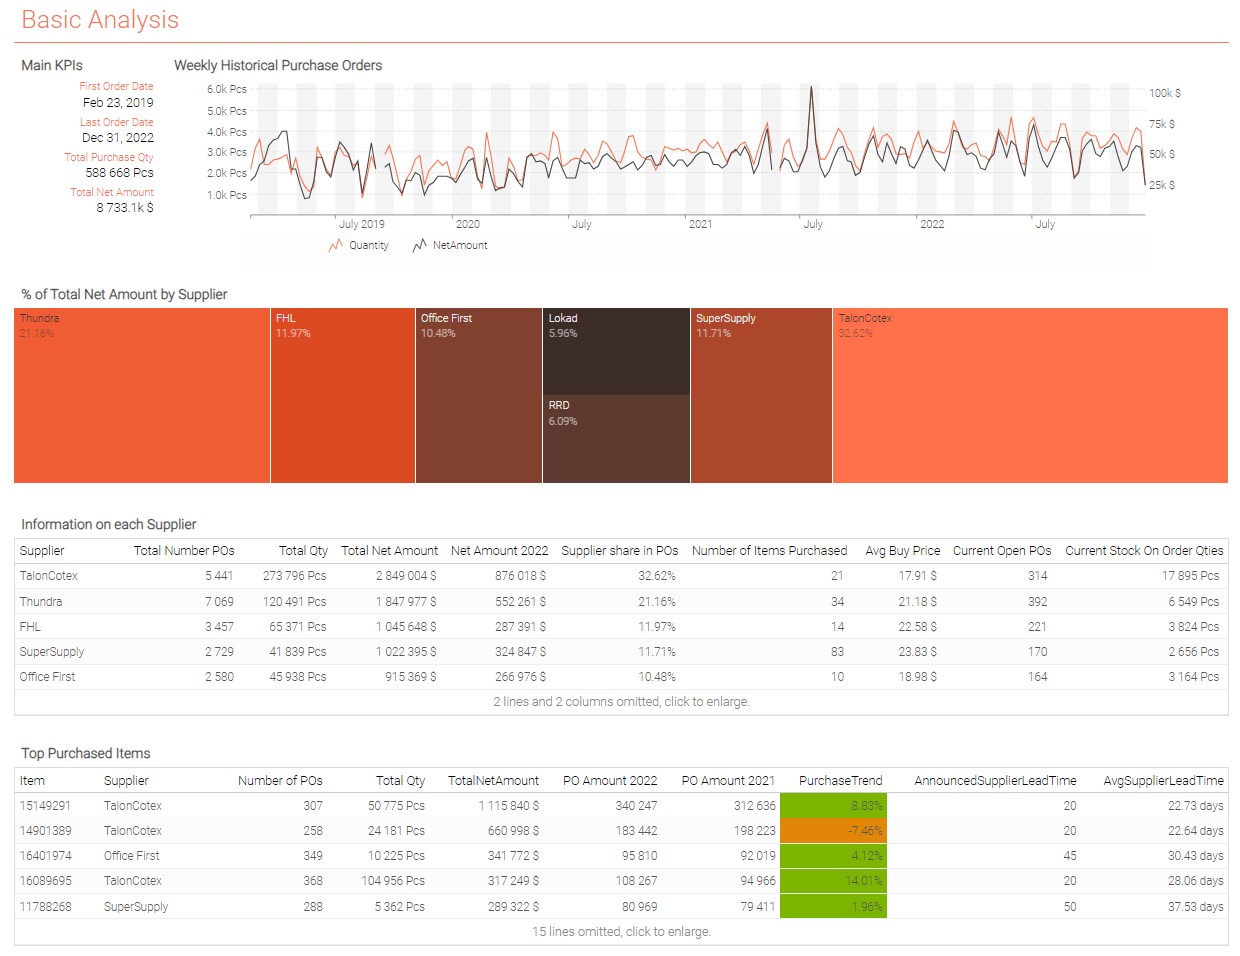
a. Orders of Magnitude
Display the following information in a summary tile: First Order Date, Last Order Date, Total Ordered Quantity, Total Net Amount.
Hint: check how aggregators work in Envision.
b. Evolution of Purchases
Display historical purchase quantities and net amounts at weekly granularity in a linechart tile. (Hint: necessary aggregation can be done using group by together with monday or week functions, but also by performing straight weekly aggregation)
c. Critical Suppliers
- To analyze which suppliers seem the most critical for the company, display the percentage of
Total Net Amountfor each Supplier
Hint: use group by optional tile synthax in a treemap tile.
- To get more detailed information, display the following information in a table tile at supplier level:
Total Number of POs,Total Quantity,Total Net Amount,Net Amount for year 2022,Number of Distinct Items Purchased,Average Buy Price,Number of Current Open POs,Current Stock On Order Quantities,Announced Supplier Leadtime,Average Supplier Leadtime. Order the table byTotal Net Amountin descending order.
Hint: use distinct aggregator.
d. Critical Items
Display the following information in a table tile at item level: Supplier, Number of Purchase Orders, Total Quantity, Total Net Amount, Purchase Amount in 2022, Purchase Amount in 2021, Purchase Amount Trend between 2021 and 2022, Announced Supplier Leadtime, Average Supplier Leadtime. Only display the top 20 items by Total Net Amount and order the table by Total Net Amount in descending order.
Hint: use the rank() function and where keyword for filtering.
1. Conclusions
Trend
CM seems to be on a positive trend, as purchases have been constantly increasing since early 2020. Of course, to confirm this assumption, we would need to do a Sales Analysis as well, to make sure the total generated turnover / margin is on the same trend.
Critical Suppliers
CM seems quite dependent on 2 suppliers, TalonCotex and Thundra. When a company relies on a few suppliers, any disruption in their supply chains can cause significant problems. For example, if one of the suppliers’ experiences production problems or goes out of business, it can lead to delays in receiving critical materials or parts, which can result in missed deadlines, lost sales, and damaged customer relationships. Relying on a small number of suppliers also makes CM vulnerable to price volatility: it will be harder to negotiate low prices if there is no competition between suppliers.
Hint: To check yourself here is an example of a dashboard that you might built. The exact layout of the dashboard and colors might be different depending on your choices.
Part 2: Limitations of Basic Analysis & Risks to Consider
2. Questions
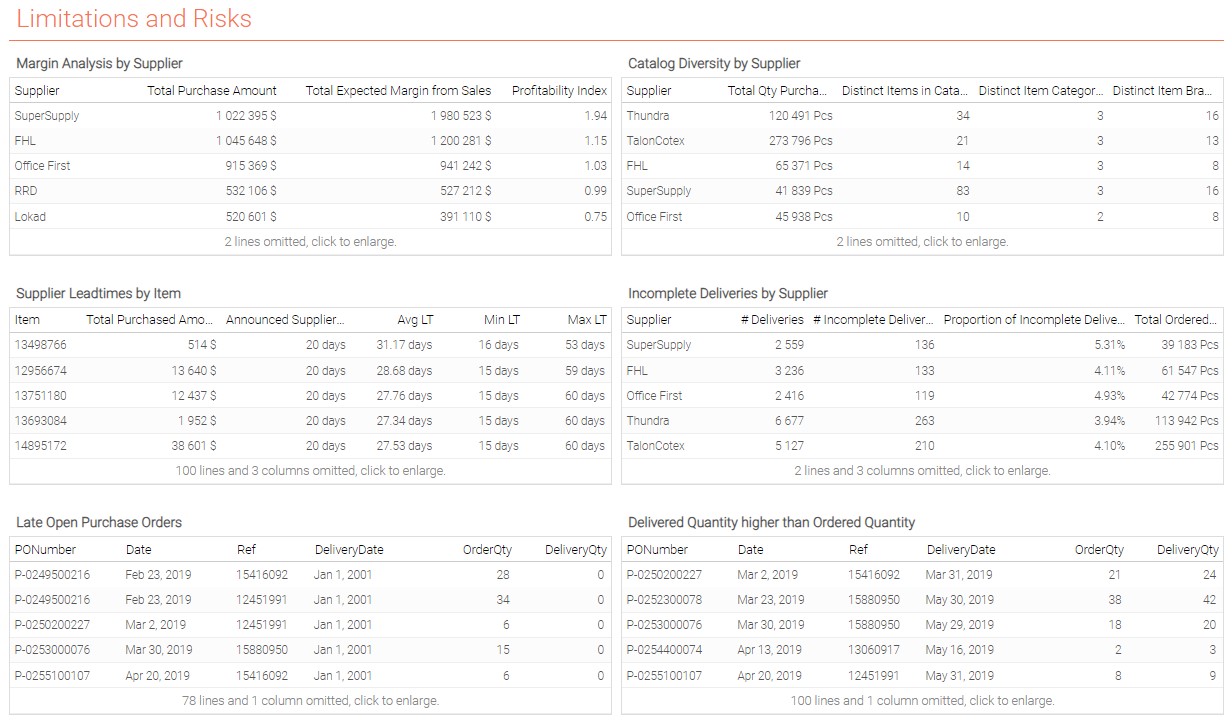
a. Financial profitability
-
Display the following information in a
tabletile at supplier level:Total Purchase Amount,Total Expected Margin from Sales(we assume every unit of stock CM purchased was sold). -
From which suppliers CM seems to be the most or least profitable? What conclusions can we draw from this?
b. Catalog Diversity/Assortment
-
Display the following information in a
tabletile at supplier level:Total Qty Purchased,Distinct Items Purchased,Distinct Item Categories Purchased,Distinct Item Brands Purchased. -
Which supplier seems to have the best assortment (i.e. the most distinct items purchased)?
c. Supplier Leadtime
-
Define Leadtime at Item level using the ranvar() function.
-
Display the following information in a
tabletile at item level (display only purchased items):Total Purchased Amount,Announced Supplier Leadtime,Avg Leadtime,Min Leadtime,Max Leadtime,Number of Closed POs,Proportion of Late Deliveries,Avg Relative Difference to Announced Leadtime(use a ponderation by purchased quantity).
- Which items seem to be the most at risk of being received with important delays? Considering the
Total Purchased Amount, which important items for CM seem to be impacted by supplier leadtime delays?
d. Defect Rates on Supplier Deliveries (missing quantities in purchase orders)
-
Display the following information in a
tabletile at Supplier level, focusing only on Closed POs:Number of Deliveries,Number of Incomplete Deliveries,Proportion of Incomplete Deliveries,Total Missing Quantities,Average Missing Quantity,Largest Incomplete Delivery. -
Which supplier has the worst defect rate (expressed in missing quantities)?
e. Data inconsistency
-
Display in a
tabletile late deliveries (older than 1 year) that are still undelivered. -
Display in a
tabletile deliveries for which quantity delivered is higher than ordered quantity.
2. Conclusions
Financial profitability
While turnover can be a useful metric for measuring the size and scale of a business, it is financial profitability that indicates whether a business is sustainable and profitable in the long run. A business can have a high turnover but still be unprofitable if its expenses and costs are too high relative to its revenue.
Profitability is essential for a business’s survival and growth as it provides the resources needed to invest in new products, hire more employees, expand to new markets, and pay dividends to shareholders. In contrast, a business with a high turnover but low profitability may struggle to compete with other businesses in the long run, especially during economic downturns or market disruptions. Of course, sacrificing margin on some items which will be loss leaders can sometimes be an efficient sales strategy to attract customers, but it cannot be applied to your whole product catalog.
From a financial perspective, we can state that SuperSupply and FHL actually are the most critical suppliers for CM.
Assortment
Working with suppliers with a wide range of products can simplify logistics and reduce administrative tasks. Consolidating purchases from one supplier can also help to reduce costs, as it may be possible to negotiate better pricing based on the volume of purchases. The variety of assortment is also a critical factor for a company as a catalog with too few items is not attractive from a customer point of view. As such, suppliers such as SuperSupply and RRD are also critical for CM.
Supplier Leadtime and Defect Rate variability
Variability in supplier leadtimes can result in unexpected wait times for inventory, which can cause stockouts or even excess inventory (if you receive stock units too late to serve an order). This can result in lost sales, a degradation of customer relations and increased carrying costs. Ignoring the fact that supplier leadtimes are highly variable makes your inventory management process irrelevant. High supplier defect rates have the same effects, as defective stocks will have to be delivered again from the supplier and will therefore be delayed.
Incomplete/Incoherent Data
Whenever data is manipulated in the process of supply chain management, data consistency checks must be done (before everything else) to ensure your data analysis reflects the operational reality. Ensuring the accuracy of data is absolutely imperative for drawing valid conclusions from a quantitative analysis. Neglecting this aspect is a frequent mistake that can lead to erroneous decision-making and misdirection. If errors or inconsistencies are found in the data, additional investigation must take place to understand what the root problem is and correct the data generation process.
Hint: To check yourself here is an example of a dashboard that you might built. The exact layout of the dashboard and colors might be different depending on your choices.
Part 3: Additional More In-Depth Observations
3. Questions
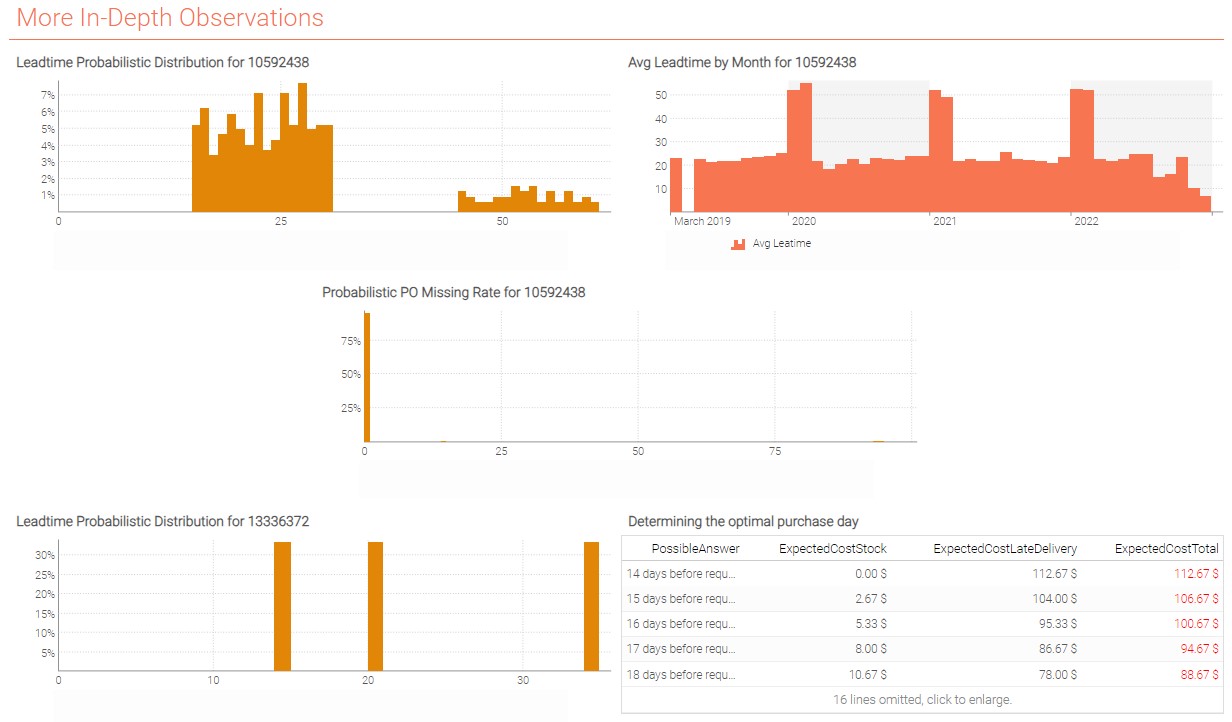
a. Leadtime Variability
Display the Supplier Leadtime distribution for Item 10592438 in a scalar tile. What observation can be made?
Hint: You may want to use single aggregator.
b. Leadtime Seasonality
To Investigate further, display in a linechart tile the average Supplier Leadtime by month for Item 10592438. Which effect do you observe? What event could cause this kind of seasonality in leadtimes? What impact does it have on CM’s Supply Chain Management for such items?
c. Defect Rate Variability
Display the Missing Quantity Rate distribution for Item 10592438 in a scalar tile. What observation can be made?
d. To go further - Handling Leadtime Variability as a Purchase Planner
-
Display the Suppler Leadtime distribution for Item
13336372in ascalartile. -
CM has to serve a special order of one pallet of Item
13336372. If we consider the following inputs, how many days before the client’s requested date should CM place the order to its supplier? Use tablePossibleAnswersalready created in the script.
Stock Cost: $8/day from the moment the order is received to the moment it is delivered
Late Delivery Cost: $13/day after client’s requested date
Delivery from CM to the customer can be done on the same day CM receives the order from its supplier (no delivery time)
Hint: To check yourself here is an example of a dashboard that you might built. The exact layout of the dashboard and colors might be different depending on your choices.
Conclusion of the Supplier Analysis
Choose your suppliers wisely
There is a good balance to find between too few suppliers on which CM would be too dependent, and too many suppliers that would be a nightmare to handle all at once. When deciding on which suppliers to order from, several angles like purchase prices, catalog variety (assortment), product quality and leadtimes must be considered. Of course, CM should always be evaluating the performance of its suppliers to ensure they remain the best choice available on the market for their needs.
Risk must always be assessed
Considering all uncertainties is crucial when managing your supply chain. A naive process based only on theoretical inputs will have no chance to succeed in a globalized world impacted by infinite variabilities. For instance, trusting a supplier will always respect their leadtimes may appear as a solution to save on purchased quantities, but as we observed during this workshop, not assessing the risk of delays could cost CM a lot.
Consider the right metrics to evaluate economic gain
As we saw in this analysis, the suppliers from which CM purchases the most are not the ones from which CM is expecting to make the best profit. Volume is not always correlated with economic profitability, which can depend on several factors and must always be challenged to ensure the company is working towards increasing margin and not only turnover. A company with a high turnover but negative margins is doomed to failure.
Annex
Get the dataset from the Envision playground
/// ## 0.2 Reading data tables

/// The list of suppliers.
read "/Suppliers.tsv" as Suppliers[Supplier] with
  /// Primary key, identifies each supplier.
  Supplier : text
  /// The delay from the order date to the delivery date, in days.
  Leadtime : number

/// The list of items, purchased and sold.
read "/Catalog.tsv" as Items[Ref] expect [Supplier] with
  /// The primary key, identifies each item.
  Ref : text
  /// Foreign key to `Suppliers`.
  Supplier : text
  /// Unit price to buy 1 unit from the supplier.
  BuyPrice : number
  /// Unit price to sell 1 unit to to a client.
  SellPrice : number
  Category : text
  Brand : text

/// The list of purchase orders, passed to suppliers.
read "/PO.tsv" as PO expect [Ref, date] with
  // Foreign key to `Items`.
  Ref : text
  /// The date when the PO was originally placed.
  "OrderDate" as date : date
  /// The date when the PO was delivered.
  /// The date `2001-01-01` indicates that the PO hasn't been delivered yet.
  DeliveryDate : date
  /// The quantity, in units, originally ordered for the item.
  OrderQty : number
  /// The quantity, in units, finally delivered for the item.
  DeliveryQty : number
  /// The price to be paid to the supplier for this PO line.
  LokadNetAmount : number
  /// When `true`, there is nothing left to be delivered.
  IsClosed : boolean
  /// Identifies the purchase orders, that may include several lines.
  PONumber : text


/// ## 0.3 Introduction
show label "Supplier Analysis" a1g1 {textAlign: center ; textBold: "true"}
show markdown "Generic Documentation" a2g2 with """
  Hi there, welcome to your first Envision exercise! Here, you will do a supplier analysis.
  You'll start by a basic analysis and draw first conclusions and limits of a
  classic approach. You'll then discover the first concepts of the Quantitative Supply Chain!
  """

/// ## 0.4 Displaying raw Data tables
show table "Items" a3b3 with
  Ref
  Items.Supplier as "Supplier"
  Items.BuyPrice as "BuyPrice"
  Items.SellPrice as "SellPrice"
  Items.Category as "Category"
  Items.Brand as "Brand"

show table "Suppliers" c3d3  with
  Suppliers.Supplier as "Supplier"
  Suppliers.Leadtime as "Leadtime"

show table "Purchase Orders" e3h3  with
  date as "OrderDate"
  PO.Ref as "Ref"
  PO.DeliveryDate as "DeliveryDate"
  PO.OrderQty as "OrderQty"
  PO.DeliveryQty as "DeliveryQty"
  PO.LokadNetAmount as "LokadNetAmount"
  PO.IsClosed as "IsClosed"
  PO.PONumber as "PONumber"

/// ## 0.5 Documentation
table PossibleAnswers = with
  [| as PossibleAnswer |]
  [| 14 |]
  [| 15 |]
  [| 16 |]
  [| 17 |]
  [| 18 |]
  [| 19 |]
  [| 20 |]
  [| 21 |]
  [| 22 |]
  [| 23 |]
  [| 24 |]
  [| 25 |]
  [| 26 |]
  [| 27 |]
  [| 28 |]
  [| 29 |]
  [| 30 |]
  [| 31 |]
  [| 32 |]
  [| 33 |]
  [| 34 |]

/// The public Envision documentation is available here: https://docs.lokad.com/