Basic sales analysis
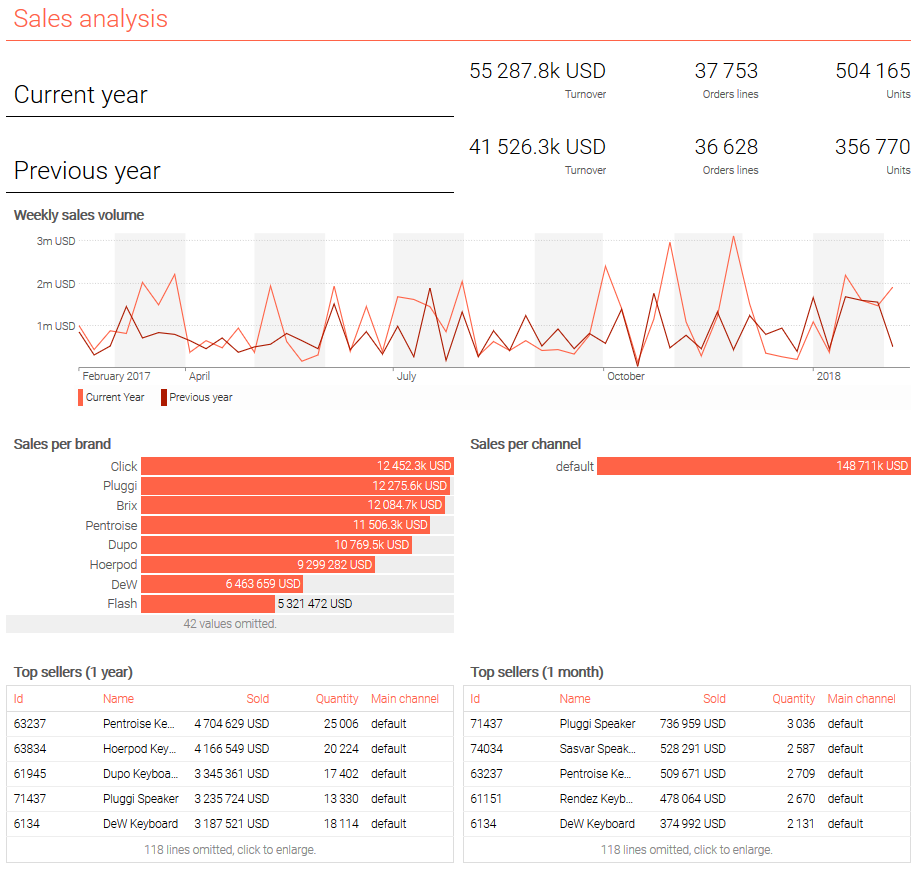
The script below illustrates how a sales analysis dashboard can be composed with Envision.
Check this script on the playground
/// Sales analysis - Lokad sample dataset 2017

read "/sample/Lokad_Items.tsv" as Items [id] with
  "Id" as id : text
  Name : text
  Brand : text
read "/sample/Lokad_Orders.tsv.gz" as Orders expect [id, date] with
  "Id" as id : text
  "Date" as date : date
  Quantity : number
  NetAmount : number
  Currency : text
read "/sample/Lokad_PurchaseOrders.tsv" as PO expect [id, date] with
  "Id" as id : text
  "Date" as date : date
  NetAmount : number
  Currency : text

show label "Sales analysis" a1f1 tomato

Orders.Channel = "default"
oend = max(Orders.date)
lastMonday = monday(oend)

// Default currency, and currency conversions
currency = mode(Orders.Currency) when (date >= oend - 365)
Orders.NetAmount = forex(Orders.NetAmount, Orders.Currency, currency, Orders.date)

// KPIs at the top
show label "Current year" a2c2
where date >= oend - 365
  show scalar "Turnover" d2 with sum(Orders.NetAmount) { unit:#(currency) }
  show scalar "Orders lines" e2 with count(Orders.*)
  show scalar "Units" f2 with sum(Orders.Quantity)

show label "Previous year" a3c3
where date < oend - 365 and date >= oend - 2 * 365
  show scalar "Turnover" d3 with sum(Orders.NetAmount)  { unit:#(currency) }
  show scalar "Orders lines" e3 with count(Orders.*)
  show scalar "Units" f3 with sum(Orders.Quantity)

// Linecharts
Week.sold = sum(Orders.NetAmount)
where date >= lastMonday - 52 * 7 and date < lastMonday
  { unit:#(currency) }
  show linechart "Weekly sales volume" a4f6 tomato with
    Week.sold as "Current Year"
    Week.sold[-52] as "Previous year"

// Split by brand and by channel
{ unit:#(currency) }
show barchart "Sales per brand" a7c9 tomato with
  sum(Orders.NetAmount)
  group by Items.Brand
  order by sum(Orders.NetAmount) desc

{ unit:#(currency) }
show barchart "Sales per channel" d7f9 tomato with
  sum(Orders.NetAmount)
  group by Orders.Channel
  order by sum(Orders.NetAmount) desc

// Top sellers, top rising
where date >= oend - 365
  show table "Top sellers (1 year)" a10c12 tomato with
    id
    Items.Name
    sum(Orders.NetAmount) as "Sold" { unit:#(currency) }
    sum(Orders.Quantity) as "Quantity"
    mode(Orders.Channel) as "Main channel"
    group into Items
    order by sum(Orders.NetAmount) desc

where date >= oend - 31
  show table "Top sellers (1 month)" d10f12 tomato with
    id
    Items.Name
    sum(Orders.NetAmount) as "Sold" // unit:" \{currency}"
    sum(Orders.Quantity) as "Quantity"
    mode(Orders.Channel) as "Main channel"
    group into Items
    order by sum(Orders.NetAmount) desc