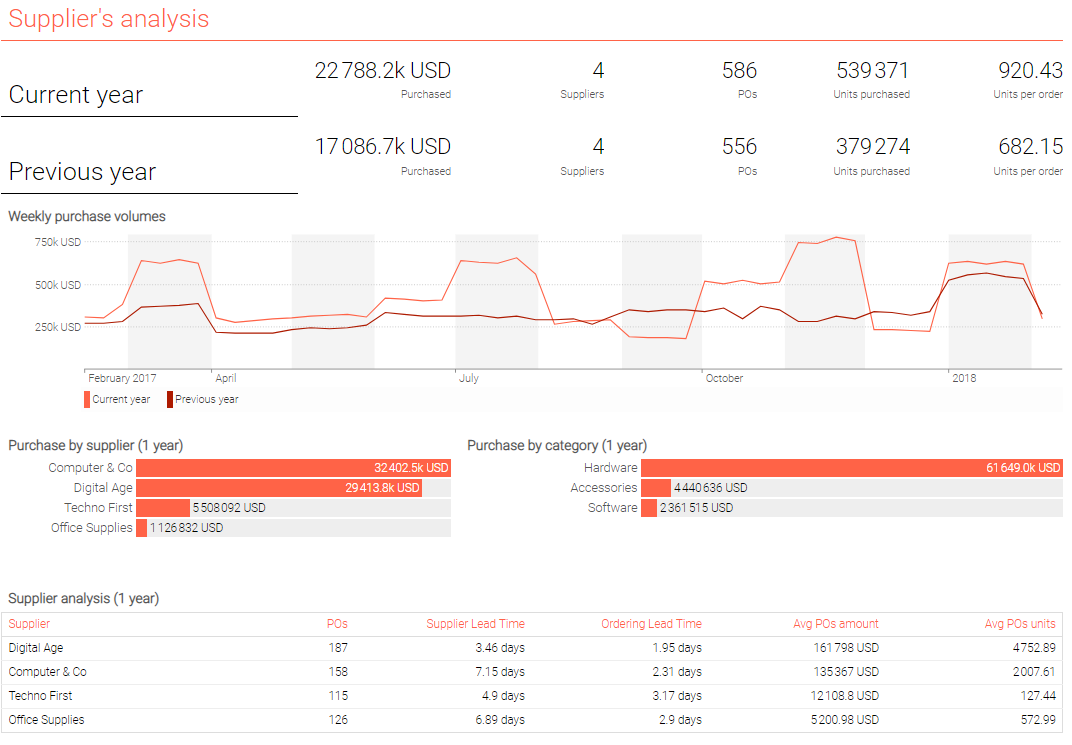
Basic supplier analysis
The script below illustrates how a supplier’s analysis dashboard can be composed with Envision.
Check this script on the playground
/// Supplier analysis - Base on the Lokad Sample Dataset 2017

read "/sample/Lokad_Items.tsv" as Items [id] with
  "Id" as id : text
  Category : text
  Supplier : text
  SupplierLeadTime : number

read "/sample/Lokad_Orders.tsv.gz" as Orders expect [id, date] with
  "Id" as id : text
  "Date" as date : date
  NetAmount : number
  Currency : text

read "/sample/Lokad_PurchaseOrders.tsv" as PO expect [id, date] with
  "Id" as id : text
  "Date" as date : date
  DeliveryDate : date
  Quantity : number
  NetAmount : number
  Currency : text

show label "Supplier's analysis" a1f1 { tileColor: tomato }

PO.Supplier = Items.Supplier
PO.OrderId = "\{PO.date}-\{PO.Supplier}"

oend = max(Orders.date)
lastMonday = monday(oend)

// Default currency, and currency conversions
currency = mode(Orders.Currency) when (date >= oend - 365)
PO.NetAmount = forex(PO.NetAmount,  PO.Currency, currency, PO.date)

// Top KPIs
show label "Current year" a2b2
where date >= oend - 365
  show scalar "Purchased " c2 with sum(PO.NetAmount) { unit: #(currency) }
  show scalar "Suppliers" d2 with distinct(PO.Supplier)
  show scalar "POs" e2 with distinct(PO.OrderId)
  show scalar "Units purchased" f2 with sum(PO.Quantity)
  show scalar "Units per order" g2 with avg(sum(PO.Quantity) by PO.OrderId)

show label "Previous year" a3b3
where date >= oend - 2 * 365 and date < oend - 365
  show scalar "Purchased " c3 with sum(PO.NetAmount) { unit: #(currency) }
  show scalar "Suppliers" d3 with distinct(PO.Supplier)
  show scalar "POs" e3 with distinct(PO.OrderId)
  show scalar "Units purchased" f3 with sum(PO.Quantity)
  show scalar "Units per order" g3 with avg(sum(PO.Quantity) by PO.OrderId)

// Linecharts
Week.purchased = sum(PO.NetAmount)
where date < lastMonday and date >= lastMonday - 52 * 7
  { unit: #(currency) }
  show linechart "Weekly purchase volumes" a4g6 { tileColor: tomato } with
    Week.purchased as "Current year"
    Week.purchased[-52] as "Previous year"

// Split by supplier
{ unit: #(currency) }
show barchart "Purchase by supplier (1 year)" a7c8 { tileColor: tomato } with
  sum(PO.NetAmount)
  group by PO.Supplier

table Categories[category] = by Items.Category
// 'category' is now a secondary dimension of 'PO'
PO.category = Items.category

{ unit: #(currency) }
show barchart "Purchase by category (1 year)" e7g8 { tileColor: tomato } with
  sum(PO.NetAmount)
  group by category

// Supplier analysis with lead times
where date >= oend - 365

  show table "Supplier analysis (1 year)" a9g11 { tileColor: tomato } with
    PO.Supplier as "Supplier"
    distinct(PO.OrderId) as "POs"
    round(avg(mode(PO.DeliveryDate - PO.date)
      by PO.OrderId),2) as "Supplier Lead Time" { unit: " days" }
    round(365 / distinct(PO.OrderId),2) as "Ordering Lead Time" { unit: " days" }
    avg(sum(PO.NetAmount)
      by PO.OrderId) as "Avg POs amount" { unit: #(currency) }
    avg(sum(PO.Quantity) by PO.OrderId) as "Avg POs units"
    group by PO.Supplier
    order by sum(PO.NetAmount) desc