Workshop #1a: Supplier Analysis (SCS Applicants version)
This workshop is intended for Supply-Chain Scientist applicants. In this workshop, we will focus on the analysis of a company’s suppliers, guiding you from a simple and naive overview to much more in-depth observations. The workshop should take between 4 and 7 hours to complete, depending on your programming skills.

Table of contents
Introduction
CM is a fictitious European company selling outdoor clothing with retail stores in three countries: Germany, France, and Italy. CM also has a strong online presence. As a European company selling outdoor clothing and sporting equipment, CM sources their products from various suppliers across the globe.
TalonCotex, a textile company based in Asia, is one of CM’s main suppliers. They specialize in producing high-quality fabrics that are ideal for outdoor clothing and running gear. Another important supplier for CM is a sporting equipment manufacturer, Thundra, based in Europe. This company produces a range of equipment, from hiking and camping gear to skiing and snowboarding equipment. CM also sources products from smaller, specialized suppliers, such as manufacturers of climbing gear or outdoor clothing.
In recent months, CM has been struggling with some of their suppliers. Despite their best efforts to maintain strong relationships with their suppliers and ensure timely delivery of products, CM has been receiving incomplete shipments or shipments that arrived well after the promised delivery date.
This has caused some disruption to their supply chain and made it difficult for CM to meet the demands of their customers.
Objectives of the workshop
The objective of this session is to identify potential risks and vulnerabilities in CM’s suppliers’ management. The session will be structured in 2 steps:
- We will start with a general overview of the suppliers’ situation
- We will engage in even more in-depth observations
Useful definitions :
- Supplier Leadtime: The Supplier Leadtime refers to the time it takes to get a Purchase Order delivered by a Supplier. It can be defined as time between Purchase Order Order Date and Purchase Order Reception Date:
PO.DeliveryDate–PO.Date. - Margin: Measures how much profit is generated by a sale. It is defined as
SellPrice–BuyPrice.
Dataset
The dataset provided for this workshop consists from 3 tables (see the data schema below). They are preloaded in the Envision playground (see lines of code #4 to #41).
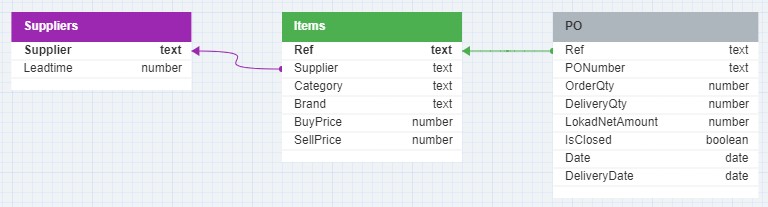
In this schema, lilac and green arrows are indicating the relationships between the tables, specifically the foreign key to primary key relationships. These relationships are essential for joining tables in a relational database to query data across different entities.
For example, the Items table, which stores information about CM’s catalogue, is a central table with relationship to the Suppliers table through its foreign key, as indicated by the lilac arrow, but also with relationship to the Purchase Orders (PO) table through its primary key, as indicated by the green arrow.
The arrow lines start from the foreign key side with the arrowheads pointing towards the primary key side, which is a typical way to denote the direction of the relationship from the foreign key in one table to the primary key in another.
1. Suppliers Table (Suppliers.tsv)
- Purpose: Contains information about the suppliers of CM.
- Contents: Includes each supplier’s name and the lead time for deliveries.
- Key Fields:
Supplier(Primary Key),Leadtime.
2. Items Table (Catalog.tsv)
- Purpose: Details each item sold by CM.
- Contents: Includes item reference, supplier, category, brand, and both buying and selling prices.
- Key Fields:
Ref(Item Reference - Primary Key),Supplier,Category,Brand,BuyPrice,SellPrice.
3. PO Table (PO.tsv)
- Purpose: Tracks purchase orders for external supplier orders.
- Contents: Features item reference, PO number, order and delivery quantities, net amount, closure status, order date, delivery date.
- Key Fields:
Ref(Item Reference),PONumber,OrderQty,DeliveryQty,LokadNetAmount,IsClosed,Date,DeliveryDate.
Part 1: Suppliers Overview – Basic Analysis
Questions
a. Orders of Magnitude
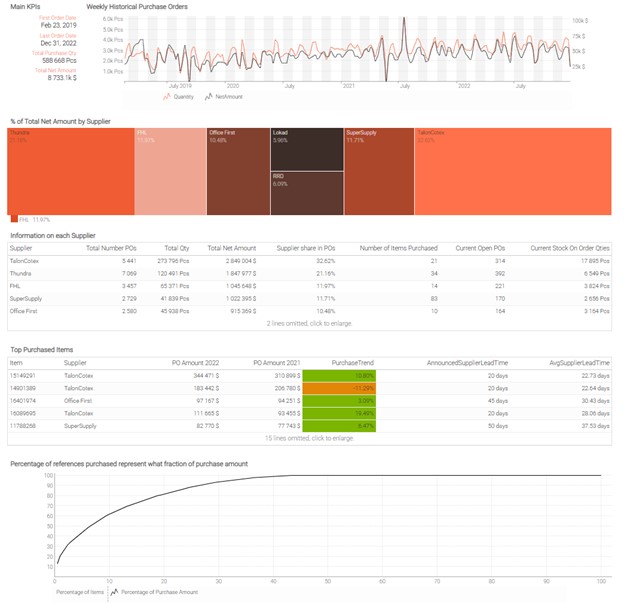
Display the following information in a summary tile: First Order Date, Last Order Date, Total Ordered Quantity, Total Net Amount.
Hint: check how aggregators work in Envision.
b. Evolution of Purchases
Display historical purchase quantities and net amounts at weekly granularity in a linechart tile. (Hint: necessary aggregation can be done using group by together with monday or week functions, but also by performing straight weekly aggregation)
c. Critical Suppliers
- To analyze which suppliers seem the most critical for the company, display the percentage of
Total Net Amountfor each Supplier
Hint: use group by optional tile synthax in a treemap tile.
- To get more detailed information, display the following information in a table tile at supplier level:
Total Quantity,Total Net Amount,Supplier share in POs,Number of Distinct Items Purchased,Number of Current Open POs. Order the table byTotal Net Amountindescendingorder.
Hint: use distinct aggregator.
d. Critical Items
Display the following information in a table tile at item level: Supplier, Purchase Amount in 2022, Purchase Amount in 2021, Purchase Amount Trend between 2021 and 2022, Announced Supplier Leadtime, Average Supplier Leadtime. Only display the top 20 items by Total Net Amount and order the table by Total Net Amount in descending order.
Hint: use the rank() function and where keyword for filtering.
e. Pareto Analysis
Display in a graph cumulatively which percentage of Items represent which fraction of whole purchase amount.
Hint: use the plot tile.
Conclusions
Trend
CM seems to be on a positive trend, as purchases have been constantly increasing since early 2020. Of course, to confirm this assumption, we would need to do a Sales Analysis as well, to make sure the total generated turnover / margin is on the same trend.
Critical Suppliers
CM seems quite dependent on 2 suppliers, TalonCotex and Thundra. When a company relies on a few suppliers, any disruption in their supply chains can cause significant problems. For example, if one of the suppliers’ experiences production problems or goes out of business, it can lead to delays in receiving critical materials or parts, which can result in missed deadlines, lost sales, and damaged customer relationships. Relying on a small number of suppliers also makes CM vulnerable to price volatility: it will be harder to negotiate low prices if there is no competition between suppliers.
Hint: To check yourself here is an example of a dashboard that you might built. The exact layout of the dashboard and colors might be different depending on your choices.
Part 2: Additional More In-Depth Observations
Questions
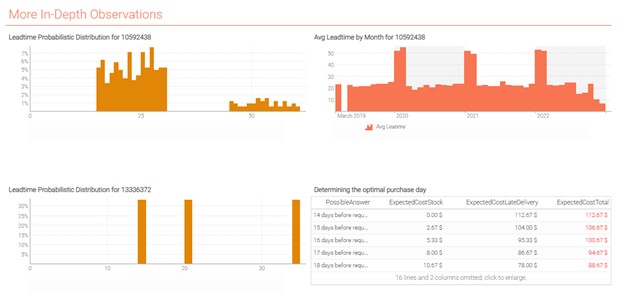
a. Leadtime Variability
Display the Supplier Leadtime distribution for Item 10592438 in a scalar tile. What observation can be made?
Hint: You may want to use single aggregator.
b. Leadtime Seasonality
To Investigate further, display in a linechart tile the average Supplier Leadtime by month for Item 10592438. Which effect do you observe? What event could cause this kind of seasonality in leadtimes? What impact does it have on CM’s Supply Chain Management for such items?
c. To go further - Handling Leadtime Variability as a Purchase Planner
-
Display the Suppler Leadtime distribution for Item
13336372in ascalartile. -
CM has to serve a special order of one pallet of Item
13336372. If we consider the following inputs, how many days before the client’s requested date should CM place the order to its supplier? Use tablePossibleAnswersalready created in the script.
Stock Cost: $8/day from the moment the order is received to the moment it is delivered
Late Delivery Cost: $13/day after client’s requested date
Delivery from CM to the customer can be done on the same day CM receives the order from its supplier (no delivery time)
Hint: To check yourself here is an example of a dashboard that you might built. The exact layout of the dashboard and colors might be different depending on your choices.
Conclusion of the Supplier Analysis
Choose your suppliers wisely
There is a good balance to find between too few suppliers on which CM would be too dependent, and too many suppliers that would be a nightmare to handle all at once. When deciding on which suppliers to order from, several angles like purchase prices, catalog variety (assortment), product quality and leadtimes must be considered. Of course, CM should always be evaluating the performance of its suppliers to ensure they remain the best choice available on the market for their needs.
Risk must always be assessed
Considering all uncertainties is crucial when managing your supply chain. A naive process based only on theoretical inputs will have no chance to succeed in a globalized world impacted by infinite variabilities. For instance, trusting a supplier will always respect their leadtimes may appear as a solution to save on purchased quantities, but as we observed during this workshop, not assessing the risk of delays could cost CM a lot.
Consider the right metrics to evaluate economic gain
As we saw in this analysis, the suppliers from which CM purchases the most are not the ones from which CM is expecting to make the best profit. Volume is not always correlated with economic profitability, which can depend on several factors and must always be challenged to ensure the company is working towards increasing margin and not only turnover. A company with a high turnover but negative margins is doomed to failure.
Annex
///# 0. Exercise Set Up

///## 0.1 Importing useful data

/// The list of suppliers.
read "/Suppliers.tsv" as Suppliers[Supplier] with
  /// Primary key, identifies each supplier.
  Supplier : text
  /// The delay from the order date to the delivery date, in days.
  Leadtime : number

/// The list of items, purchased and sold.
read "/Catalog.tsv" as Items[Ref] expect [Supplier] with
  /// The primary key, identifies each item.
  Ref : text
  /// Foreign key to `Suppliers`.
  Supplier : text
  /// Unit price to buy 1 unit from the supplier.
  BuyPrice : number
  /// Unit price to sell 1 unit to to a client.
  SellPrice : number
  Category : text
  Brand : text

/// The list of purchase orders, passed to suppliers.
read "/PO.tsv" as PO expect [Ref, date] with
  // Foreign key to `Items`.
  Ref : text
  /// The date when the PO was originally placed.
  "OrderDate" as date : date
  /// The date when the PO was delivered.
  /// The date `2001-01-01` indicates that the PO hasn't been delivered yet.
  DeliveryDate : date
  /// The quantity, in units, originally ordered for the item.
  OrderQty : number
  /// The quantity, in units, finally delivered for the item.
  DeliveryQty : number
  /// The price to be paid to the supplier for this PO line.
  LokadNetAmount : number
  /// When `true`, there is nothing left to be delivered.
  IsClosed : boolean
  /// Identifies the purchase orders, that may include several lines.
  PONumber : text

///## 0.2 Introduction
show label "Supplier Analysis" a1h1 {textAlign: center ; textBold: "true"}
show markdown "Generic Documentation" a2h4 {tileZoom: false} with """
  Hi there, welcome to your first Envision exercise! In this exercise, you will do a supplier analysis.
  You'll start by a basic analysis and draw first conclusions and limits of a classic approach.
  You'll then discover the first concepts of the Quantitative Supply Chain!
  The public Envision documentation is available here: __https://docs.lokad.com__.
  A non exhaustive list of interesting pages:
  * __https://tube.lokad.com/videos/watch/943f8aa9-75fc-435f-afa9-f178ca73038a?title=0&warningTitle=0__
  * __https://docs.lokad.com/language/relational-algebra/__
  * __https://docs.lokad.com/language/relational-algebra/natural-joins/__
  * __https://docs.lokad.com/language/relational-algebra/aggregating/__
  * __https://docs.lokad.com/language/relational-algebra/filtering/__
  * __https://docs.lokad.com/language/relational-algebra/secondary-dimensions/__
  * __https://docs.lokad.com/language/__
  * __https://docs.lokad.com/reference/__
  * __https://docs.lokad.com/legacy/envision-user-guide/designing-dashboards/#title-position-and-color__
    (for placing easily tile on the dashboard)
"""

///## 0.3 Displaying raw Data tables
/// a5b5 represent the position of the tile on the grid; see
/// https://docs.lokad.com/legacy/envision-user-guide/designing-dashboards/#title-position-and-color
/// for more details
show table "Items" a5b5 with
  Ref
  Items.Supplier as "Supplier"
  /// {unit: "$"} is a Stylecode property to polish the dashboard appearance.
  /// Stylecode can be edited through the tile editor or directly in the script:
  /// https://docs.lokad.com/specifications/stylecode/v1/elements/
  Items.BuyPrice as "BuyPrice" {unit: "$"}
  Items.SellPrice as "SellPrice" {unit: "$"}
  Items.Category as "Category"
  Items.Brand as "Brand"

show table "Suppliers" c5d5  with
  Suppliers.Supplier as "Supplier"
  Suppliers.Leadtime as "Leadtime" {unit: " days"}

show table "Purchase Orders" e5h5 with
  PO.date as "OrderDate"
  PO.Ref as "Ref"
  PO.DeliveryDate as "DeliveryDate"
  PO.OrderQty as "OrderQty"
  PO.DeliveryQty as "DeliveryQty"
  PO.LokadNetAmount as "LokadNetAmount" {unit: "$"}
  PO.IsClosed as "IsClosed"
  PO.PONumber as "PONumber"
/// Important: when the delivery date is equal to 01/01/2001, this means that the PO hasn't been delivered yet

/// ## 0.4 Documentation
/// The public Envision documentation is available here: https://docs.lokad.com/
/// Non exhaustive list of interesting pages
/// https://tube.lokad.com/videos/watch/943f8aa9-75fc-435f-afa9-f178ca73038a?title=0&warningTitle=0
/// https://docs.lokad.com/language/relational-algebra/
/// https://docs.lokad.com/language/relational-algebra/natural-joins/
/// https://docs.lokad.com/language/relational-algebra/aggregating/
/// https://docs.lokad.com/language/relational-algebra/filtering/
/// https://docs.lokad.com/language/relational-algebra/secondary-dimensions/
/// https://docs.lokad.com/language/
/// https://docs.lokad.com/reference/

///# Useful for part 3
table PossibleAnswers = with
  [| as PossibleAnswer |]
  [| 14 |]
  [| 15 |]
  [| 16 |]
  [| 17 |]
  [| 18 |]
  [| 19 |]
  [| 20 |]
  [| 21 |]
  [| 22 |]
  [| 23 |]
  [| 24 |]
  [| 25 |]
  [| 26 |]
  [| 27 |]
  [| 28 |]
  [| 29 |]
  [| 30 |]
  [| 31 |]
  [| 32 |]
  [| 33 |]
  [| 34 |]
///the table above displays different possibilities for the number of days before the client's requested date at which CM should place the order

/// The public Envision documentation is available here: https://docs.lokad.com/