treemap
treemap, tile type
The treemap tile displays a data table as a two-dimensional map, with one rectangle for each line, and the area of that rectangle proportional to that line’s value.
The intent of treemap is to be an alternative to the barchart and piechart tiles with greater data density (since scaling is done based on rectangle area, rather than just bar width or arc size), but at the cost of labels or values on smaller rectangles not being visible.
table T = with
  [| as Total, as Name,     as Category,     as Color |]
  [| 7.0,    "USA",        "North America", "blue" |]
  [| 3.0,    "Canada",     "North America", "blue" |]
  [| 6.0,    "Germany",    "Europe",        "red"  |]
  [| 5.0,    "France",     "Europe",        "red"  |]
  [| 4.0,    "Italy",      "Europe",        "red"  |]
  [| 0.5,    "Luxembourg", "Europe",        "red"  |]

show treemap "By category (with color)" with
  T.Total { value { color: #[T.Color] } }
  T.Name
  T.Category
The first series is the value, and should be a number strictly greater than zero 0. The second series is the label, and should be a text value. The third series is the category. The category is optional. When the category is present, it causes the contents of each category to be grouped in the display.
Hovering over any rectangle does display that rectangle’s label and value, assuming that it is large enough to appear in the map at all.
Unlike barchart and piechart, there is a limit of 1000 elements that can be displayed in a treemap tile.
Unlike barchart, treemaps are also not able to display negative or zero values, and will report an error when they are encountered.
Annex: complex example
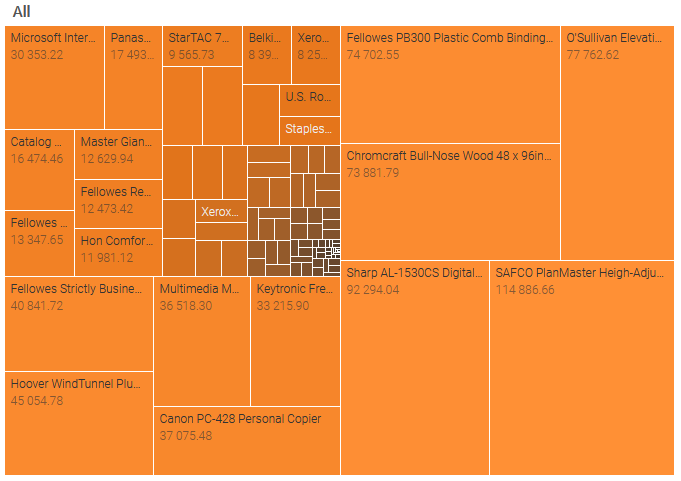
This annex illustrates the visuals that can be obtained with a treemap.
show treemap "All" F19143 with
  Items.TotalSales
  Items.Name
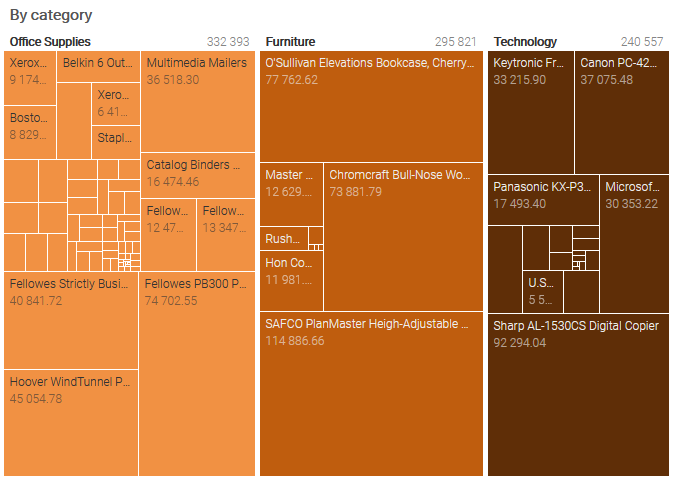
A category is added.
show treemap "By category" F19143 with
  Items.TotalSales
  Items.Name
  Items.Category
A color gradient is chosen based on the tile color, with one color for each category.
show treemap "All (with color)" with
  Items.Total { value { color: #[Categories.Color[Items.Category]] } }
  Items.Name
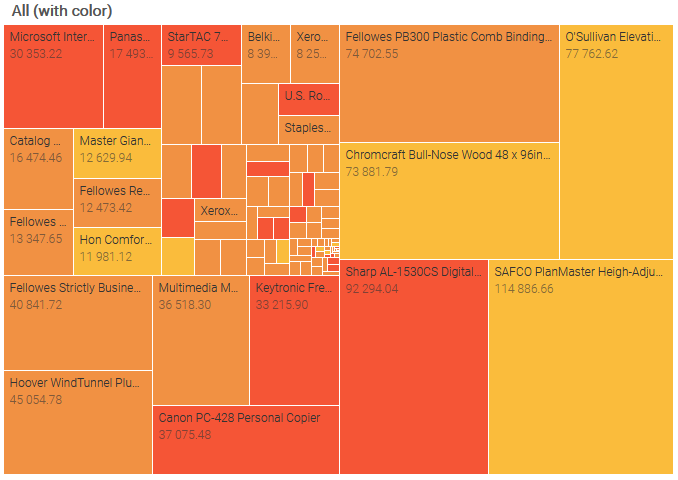
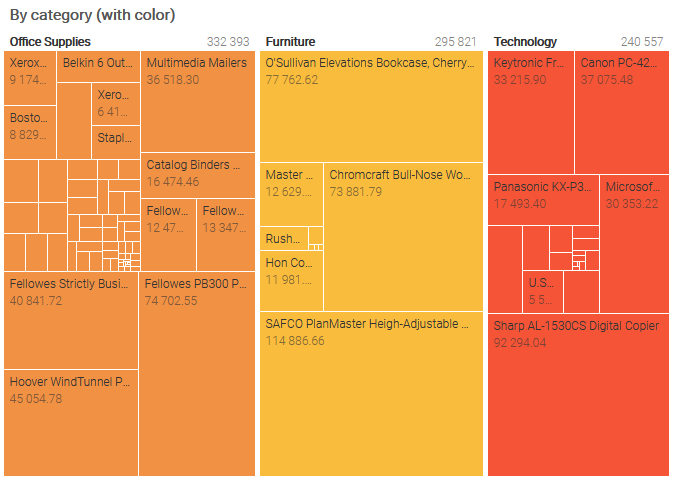
The color can be independent of the category, but matching the color with category tends to produce a pleasing appearance:
show treemap "By category (with color)" with
  Items.Total { value { color: #[Categories.Color[Items.Category]] } }
  Items.Name
  Items.Category
StyleCode
For generic StyleCode rules, see stylecode.
- treemap tile
- series and value