User inputs
The content of a dashboard produced by Envision can be driven by user inputs performed directly on the dashboard itself. Those capabilities are of interest for data exploration purposes, where the intent is to zoom in on specific areas (e.g. a part, a store, a time-period), but also for advanced simulation purposes, typically enabling a variety of what-if analyses. Envision supports four distinct kinds of user inputs: the slices, the forms, the file uploads, and an upload-editable combinations. Each input has its most suitable use cases. In the following, we document all these features that support user-driven dashboards.
Overview
While it is possible to perform data exploration by directly editing the Envision code, for example adjusting some where statements to filter the specific data of interest, Lokad is not only intended for an audience of Supply Chain Scientists capable of editing Envision scripts. Yet, this audience - either less technically inclined or simply less familiar with Envision - might benefit from being offered a degree of control over the dashboard themselves. In order to support those scenarios, Envision can process user inputs provided directly through the dashboard itself. This capability is of interest for many scenarios.
Data inspection: Sometimes data pipelines connecting production systems to Lokad are imperfect, and users might wish to be able to quickly perform sanity checks, verifying that the data present within Lokad is properly reflecting what they see on their systems. These verifications are used to rule out garbage-in garbage-out problems, which may occur when the data pipeline itself is dysfunctioning.
Explorative insights: A supply chain decision, such as a purchase order quantity, can be dependent on many inputs, including advanced statistical calculations - e.g. a probabilistic demand forecast and a probabilistic lead time forecast. In order to make sense of a suggested decision, it might be relevant to gather all the relevant inputs in a single dashboard.
What-If scenarios: The profitability of supply chain decisions is likely to be highly dependent on many factors - e.g. cost of transport, minimal order quantity, price breaks, etc. Those factors might even be part of the input data. However, it could be of interest to be able to assess “what-if” scenarios where one or more of those factors would be associated to different values.
Staged workflows: The supply chain practitioner wants to preserve the possibility to fully override the suggested purchase quantity as computed by an Envision script. The practitioner wants to amend the quantities in any way he/she sees fit, but also let the dashboard be refreshed with numbers reflecting the economics of the modified quantities.
In order to support these use cases, and more, Envision provides several mechanisms to let users dynamically interact with Envision dashboards without touching the code itself. The four methods are namely:
- the dashboard slices which are best suited for data exploration purposes.
- the form tile which is best suited for what-if scenarios.
- the upload tile which is best suited for workflows, where quantities or prices are amended in batch.
- the editable table which is best suited for relatively small modifications of the uploaded tables.
Dashboard slices
Dashboard slices are the most suitable approach for data exploration because they do not involve re-running the Envision dashboard. Instead, many dashboard views are pre-computed - one for every “slice” - and it becomes possible to navigate from one slice to another using the slice selector, which provides a search-like user experience.
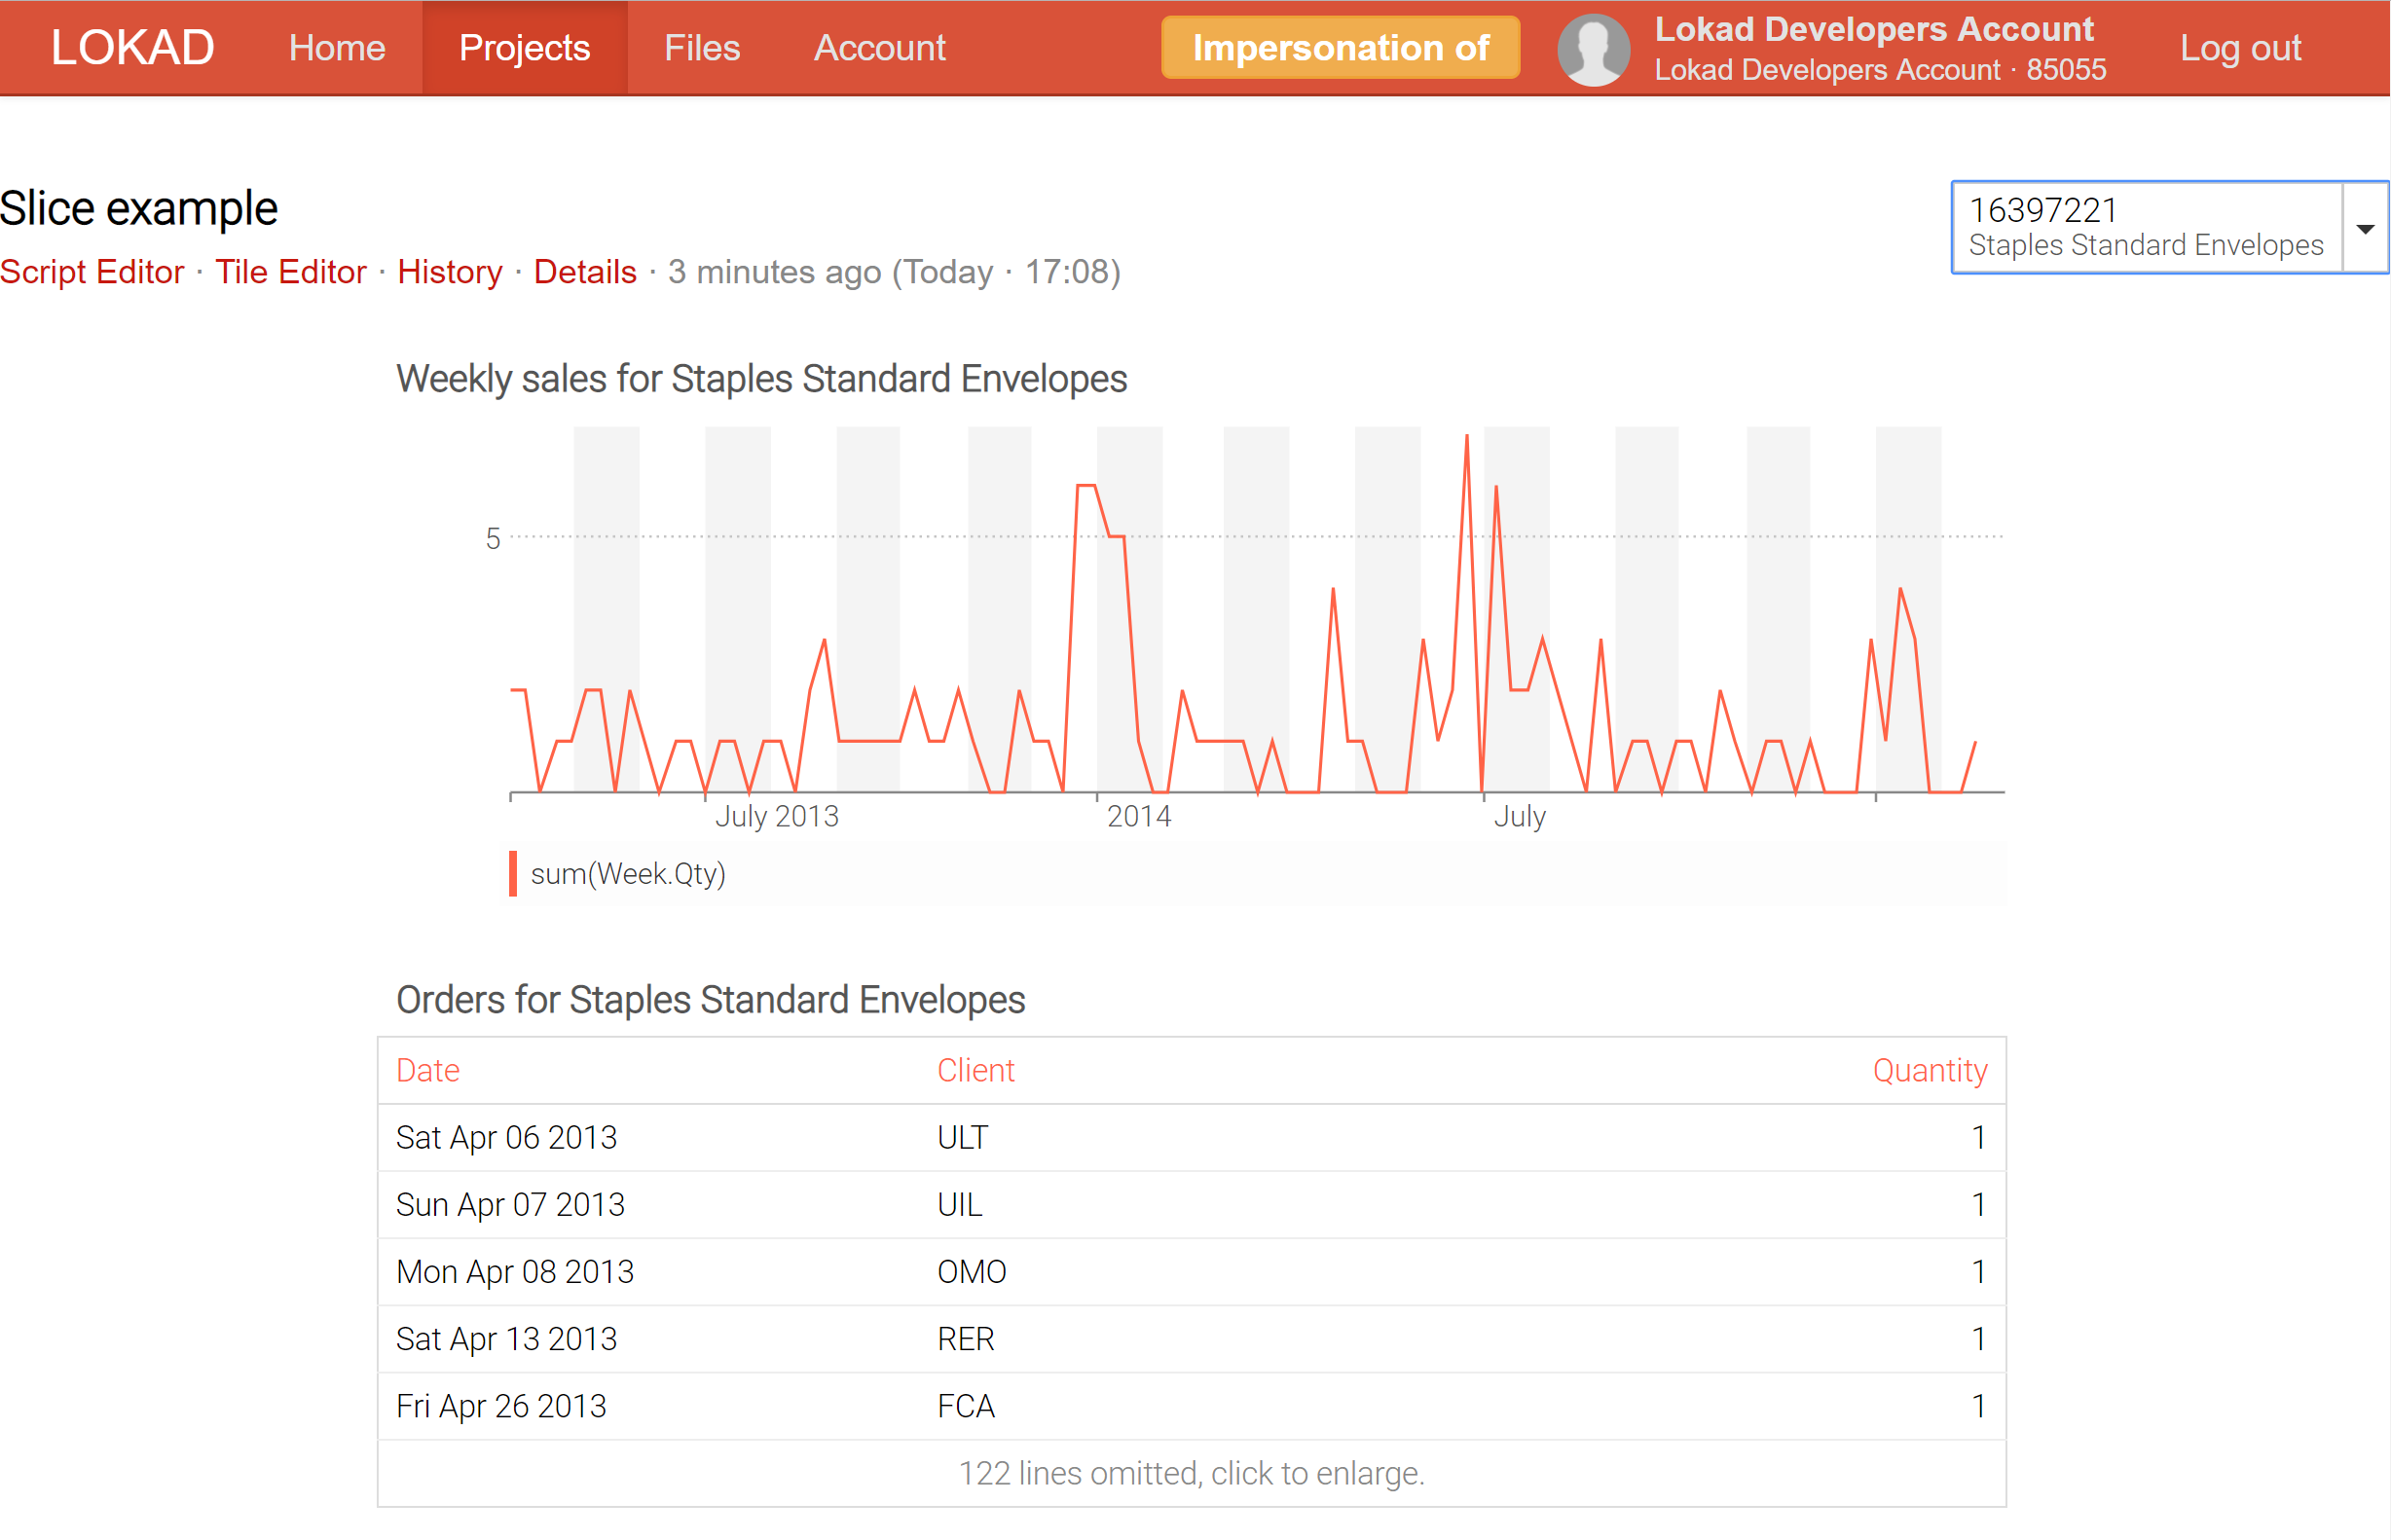
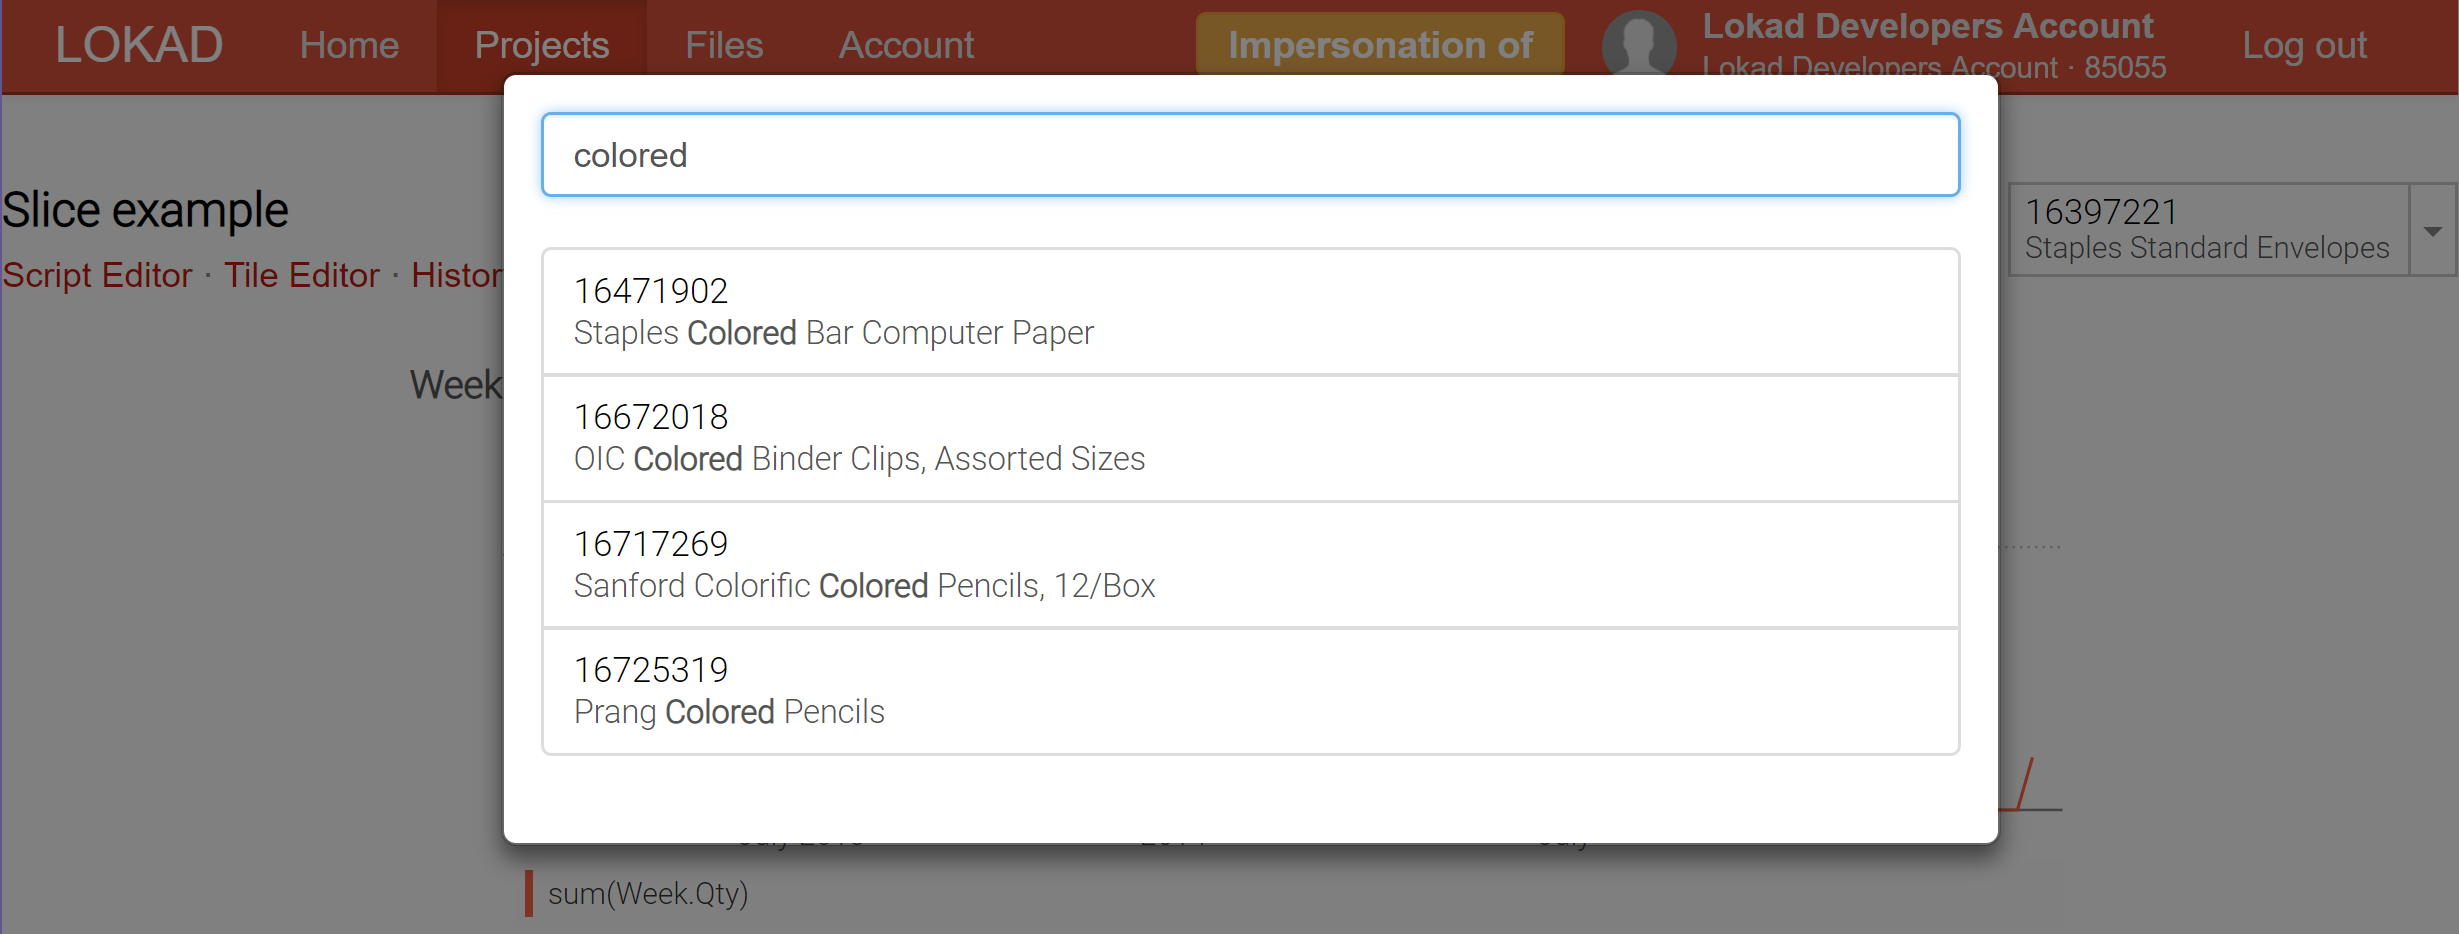
By clicking the slice selector on the upper right corner, the dashboard offers a search box, as illustrated in the screenshot below.
The dashboard above has been generated using the sample dataset and the following script:
read "/sample/Lokad_Items.tsv" as Items[Id] with
  Id : text
  Name : text
  Category : text
  SubCategory : text
  Brand : text
read "/sample/Lokad_Orders.tsv" as Orders expect [Id, Date] with
  Id : text
  Date: date
  Quantity: number
  Client: text

table Slices[slice] = slice by Id title: Id subtitle: Name
WeekItems.Slice = slice

WeekItems.Qty = sum(Orders.Quantity)
Week.monday = same(monday(date)) into Week

show linechart (same("Weekly sales for \{Name}") by Slice) a1d3 tomato slices: WeekItems.Slice with
  sum(Week.Items.Qty)
  group by Week.monday

show table (same ("Orders for \{Name}") by Slice) a4d6 tomato slices: Items.Slice with
  Orders.Date
  Orders.Client
  Orders.Quantity
  order by Orders.Date
Within Envision, a slice is technically a special datatype. Each dashboard is allowed to have a slice set. Slices are numbered internally from 0 to $n-1$.
To create the slices for a dashboard, create the Slices table anywhere in the script (but no more than once):
table Slices[slice] = slice by [arg0, arg1, ...] title: name subtitle: label
In this example, there will be one slice for each distinct value of the [arg0, arg1, ...] tuple. The slice identifier assigned to each value then broadcasts back to the original table, here Items. Selecting a slice - through the dashboard user interface - consists of selecting the internal identifier of the slice through a search bar, which also offers auto-completion to narrow down the possible choices until one can be picked.
Auto-completion is based on searching through the display text of the slice, which is composed of two arguments:
- The name value of the slice, which should be the same for all lines in a slice.
- The label (optional), which also should be the same for all lines in a slice.
Then, most tiles can be sliced through the slices option, as by passing a slice value. For example, for the table tile in the script above,
show table "My Orders" slices: Items.Slice with
  Orders.Date
  Orders.Client
  Orders.Quantity
  order by Orders.Date
Having group by columns is also possible, in which case the grouping is done independently on each slice:
show table "My Orders" slices: Items.Slice with
  Orders.Client
  sum(Orders.Quantity)
  group by Orders.Client
In the example above, we have customized the title of the tiles to have a different display per slice. We have achieved that using the expression (same("Weekly sales for \{Name}") by Slice) for the title of the slice.
In fact, under the hood, as soon as a Slices table is introduced in the code, every single [StyleCode](/legacy/envision-reference/stylecode/] properties of every single tile gets sliced - no matter whether the slices option appear or not on a given tile. The option slices acts as a filter on data that is injected on the tile for any given slice, while the StyleCode properties control the overall appearance of the tile.
For example, the label tile is pure StyleCode and no-data, and its display can be adjusted per slice with:
show label (same("Weekly sales for \{Items.Name}") by Items.Slice)
Many if not most of the scalar options of tiles are StyleCode properties, but not all of them. For example, the write: option of the table tile is not a StyleCode property, and attempting to slice this option will fail.
In terms of syntax, when slicing, the linechart requires an explicit group by statement, which might feel unusual. In fact, this only reflects that the linechart aggregate by date is by default. Hence, the code:
Week.monday = same(monday(date)) into Week
show linechart "My linechart" with
  sum(Week.Items.Qty)
Is actually implicitly the short version of the more explicit code where the grouping has been made explicit:
Week.Items.Qty = sum(Orders.Quantity)
Week.monday = same(monday(date)) into Week
show linechart "My linechart" with
  sum(Week.Items.Qty)
  group by Week.monday
The later version can be sliced with:
table Slices[slice] = slice by Id title: Id subtitle: Name
Week.Items.Slice = Items.Slice
Week.Items.Qty = sum(Orders.Quantity)
Week.monday = same(monday(date)) into Week
show linechart "My linechart" slices: Week.Items.Slice with
  sum(Week.items.Qty)
  group by Week.monday
Envision does not accept slicing the linechart under implicit grouping because the aggregation itself becomes somewhat ambiguous. Thus, in order to slice a linechart a few extra line of codes are introduced as illustrated above
Form tile
The form tile offers the possibility to enter values directly from the dashboard itself; these values then become available within the Envision script as scalar variable. This feature is made possible by the form tile. For example, the following script lets the user enter two values: a Boolean and a number.
expect Form.Coef : number
expect Form.IsTicked : boolean
show form "My settings" with
  Form.Coef as "Coefficient"
  Form.IsTicked as "Check this case to change the Boolean variable"
As the form values can be completely adapted to the problem at hand, the form tile is handy when it comes to generating complex what-if scenario simulators. Also, end-users don’t need to known anything about Envision to use a parameterized dashboard that leverages the form tile. For them, it’s just a regular web page with a form to fill in.
However, whenever new entries are filled within the form tile, the Envision code needs to be re-run in order to have the newer entries taking effect. Considering that Envision has an architecture oriented toward batch processing, it means that the refresh should be expected to take multiple seconds even if the amount of data is very limited.
Thus, if the users need a real-time feedback while interacting with the dashboard, it is suggested to use the slices that we introduced above. Also, as a rule of thumb, if as soon as your form tile includes more than 10 values, it’s probably time to start considering the upload tile as a better alternative to feed a large number of parameters to the Envision logic.
Upload tile
The upload tile offers the possibility to upload a flat file - typically a Microsoft Excel spreadsheet - and make its content accessible within the Envision code. The file is expected to be plainly tabular, with the first line containing the column headers. The newly uploaded content becomes available as a table within Envision. This syntax follows:
read upload "mysuppliers" as MySuppliers with
  SupplierId : text
  SupplierQuota : number
  SupplierCountry : text

show upload "Supplier settings" with MySuppliers.*
The upload tile need a pattern provided as text literal equal to the lowercase version (i.e. mysuppliers above) of the table name (i.e. MySuppliers above).
Even without the upload tile, it was already possible to drop a Excel file directly the in the Files tab within the Lokad account under a well-specified path, and to read this file from Envision with a regular read statement, instead of the read upload outlined above. However, this approach has a few drawbacks that are precisely solved by the upload tile:
- There is no need to navigate back and forth between the dashboard and the Files tab.
- The possibility of misnaming the file, leading to unintended behaviors, is eliminated.
- The script will not fail if no file is provided (yet), instead the table will be treated as empty.
Like the form tile, the newly uploaded values will only come into effect with the upload tile when the Envision code is re-executed. The upload tile is handy when the intent is to feed many - possibly thousands - of parameters at once to Envision. Thus, a delay of several seconds or more should be expected to refresh the dashboard, even if the amount of data is relatively limited.
Editable table
The purpose of the editable table is to manually modify entries directly from the Envision dashboard.There is currently no enforced limit, but it is recommended modifying between 10 and 1000 lines. Below the number of 10, an Envision form is preferable; above 1000, a direct spreadsheet upload is favored. Relatively larger modifications manually incorporated into the table might cause the browser to fail or the saving of the editable to time out. Modifications of a significant size should be made directly in the file to be uploaded into the dedicated folder.
The editable table provides a grid edition experience similar to what one would expect from Excel. However there are two major differences. First, Envision does not provide any real-time updates for the cells beside the cells being edited. Edited changes are only propagated once the dashboard is refreshed, which is typically a multi-seconds operation. Second, Envision provides more edition-wise control than Excel. For example, columns can be marked as read-only. In this respect, editable tables are slightly closer to Access rather than Excel.
Editing a table is possible using the show table option. When a table is marked with editable in the dashboard, zooming in on the table should display the table editor instead of just the enlarged table. The editor receives its configuration from the properties and StyleCode of the table (e.g., the type and name of each column). Refer to our Styling dashboards section for more insights. A full list of target elements and their properties is provided in our StyleCode reference section.
The current implementation of the editable table still relies on the upload tile and is far from being excellent. This implementation introduces a few accidental technicalities which are intended to be lifted in a later version of Envision. Below, we outline a three-fold logic that is required to leverage the editable table as it presently exists in Envision.
The code starts by reading a table that will be edited and the initialization of the selected values. The first code snippet reads as follows:
//Step 1
pathExport = "/sampletest/"

read "/sample/Lokad_Items.tsv" as Items[Id] with
  Id : text
  Name : text
  Category : text
  SubCategory : text
  Brand : text
  Supplier : text
  SellPrice : number

//Step 1: read a table that will be edited
read upload "newtable" as Editable expect [Id] with
  Id : text
  "Validation" as IsToMoveText : text

//Step 1: run the following initialization line
Items.IsToMoveText = "N"

show table "" a1c3 f5a623 editable: "newtable" write:"\{pathExport}/editable/newtable.ion" {numbers: "simple"} with
  Id {columnReadOnly: "true"}
  Items.IsToMoveText as "Validation"
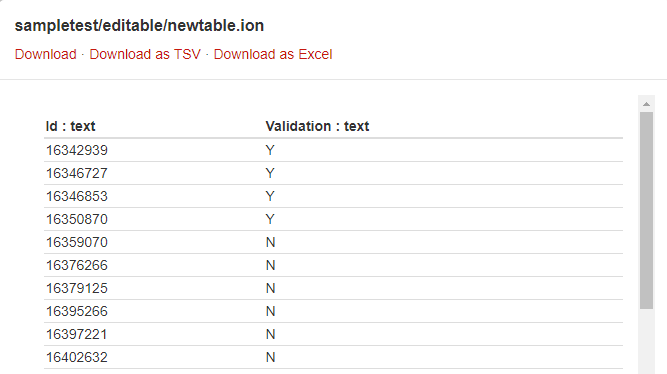
This allows displaying a table that is about to be edited:
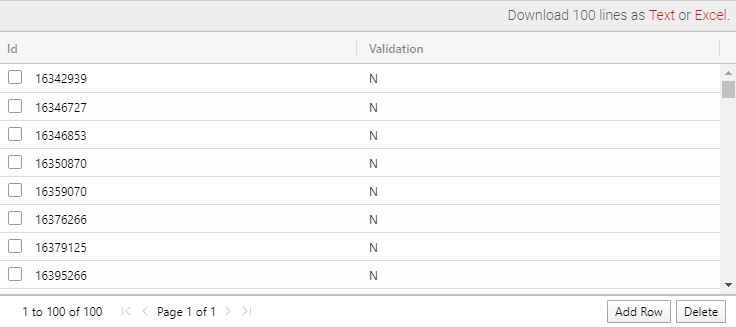
This table is exported into the /sampletest/editable folder:

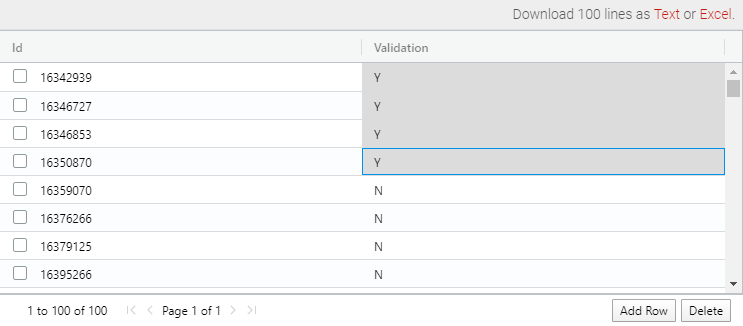
In the second step, it is necessary to access the dashboard, manually edit the displayed table, and hit the Start Run button:
In the third step, the following modification shall be introduced into the initial code snippet: rewriting the initialization modifying lines as follows:
//Step 3
pathExport = "/sampletest/"

read "/sample/Lokad_Items.tsv" as Items[Id] with
  Id : text
  Name : text
  Category : text
  SubCategory : text
  Brand : text
  Supplier : text
  SellPrice : number

//Step 3: as before, read a table that will be edited
read upload "newtable" as Editable expect [Id] with
  Id : text
  "Validation" as IsToMoveText : text

//Step 3: comment the initialization line
// IsToMoveText = "N"

//Step 3: add the following line
Items.IsToMoveText = same(Editable.IsToMoveText)

show table "" a1c3 f5a623 editable: "newtable" write:"\{pathExport}/editable/newtable.ion" {numbers: "simple"} with
  Id {columnReadOnly: "true"}
  Items.IsToMoveText as "Validation"
Once the script is rewritten, the script must be re-run. It allows saving the modifications manually introduced into the table and export the updated file into the /sampletest/editable folder:
When closing the zoom modal, the new values should be displayed in the table tile. The “download as Text or Excel” links in the top right of the zoom modal should still be displayed, as in the non-editable version. If the tile has been edited, downloading the edited version becomes possible.