Basic stock analysis
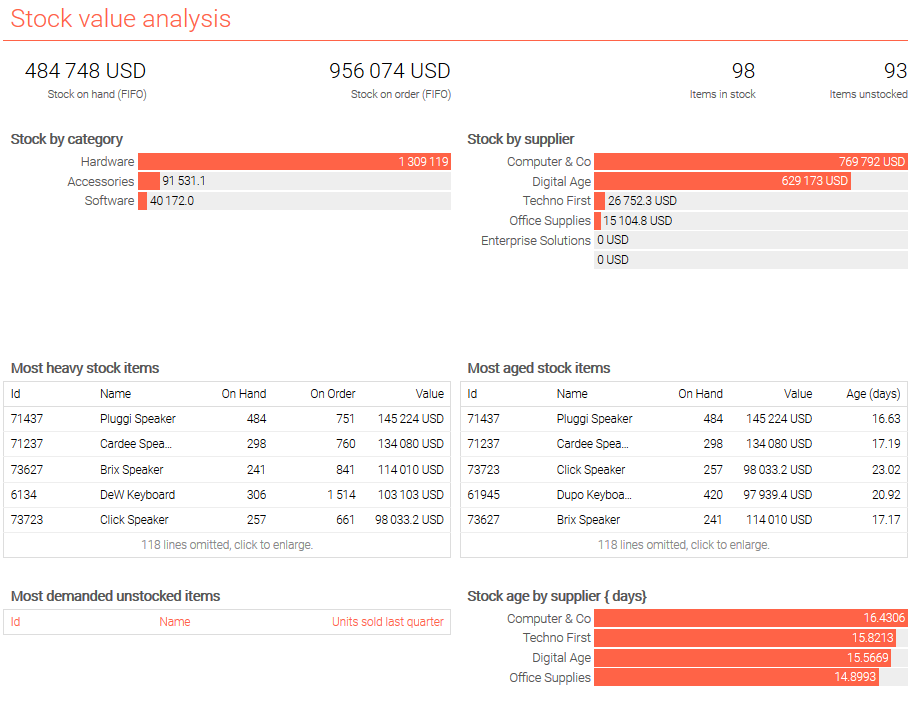
The script below illustrates how a stock analysis dashboard can be composed with Envision.
Check this script on the playground
/// Stock analysis - Lokad sample dataset 2017

read "/sample/Lokad_Items.tsv" as Items[id] with
  "Id" as id : text
  Name : text
  Category : text
  Supplier : text
  StockOnHand : number
  StockOnOrder : number

read "/sample/Lokad_Orders.tsv.gz" as Orders expect [id, date] with
  "Id" as id : text
  "Date" as date : date
  Quantity : number
  NetAmount : number
  Currency : text

read "/sample/Lokad_PurchaseOrders.tsv" as PO expect [id, date] with
  "Id" as id : text
  "Date" as date : date
  Quantity : number
  NetAmount : number
  Currency : text

show label "Stock value analysis" a1f1 tomato
oend = max(Orders.date)

// Default currency, and currency conversions
currency = mode(Orders.Currency) when (date >= oend - 365)
Orders.NetAmount = forex(Orders.NetAmount, Orders.Currency, currency, Orders.date)
PO.NetAmount = forex(PO.NetAmount, PO.Currency, currency, PO.date)

// FIFO inventory valuation
PO.Fifo = fifo(Items.StockOnHand + Items.StockOnOrder, PO.date, PO.Quantity)
Items.Fifo = sum(PO.Fifo * PO.NetAmount / PO.Quantity)

PO.Fifo2 = fifo(Items.StockOnOrder, PO.date, PO.Quantity)
Items.Fifo2 = sum(PO.Fifo2 * PO.NetAmount / PO.Quantity)

// FIFO inventory age
StockAge = sum(PO.Fifo * (oend - PO.date)) /. sum(PO.Fifo)

// Top row of KPIs
show scalar "Stock on hand (FIFO)" a2 with sum(Items.Fifo - Items.Fifo2) { unit: #(currency) }
show scalar "Stock on order (FIFO)" c2 with sum(Items.Fifo2) { unit: #(currency) }
show scalar "Items in stock" e2 with count(Items.StockOnHand + Items.StockOnOrder > 0)
where date > oend - 31
where sum(Orders.Quantity) by id > 0
  show scalar "Items unstocked" f2 with count(Items.*)

// Stock by category and supplier
show barchart "Stock by category" a3c5 tomato with
  sum(Items.Fifo)
  group by Items.Category
  order by sum(Items.Fifo) desc

{ unit: #(currency) }
show barchart "Stock by supplier" d3f5 tomato with
  sum(Items.Fifo)
  group by Items.Supplier
  order by sum(Items.Fifo) desc

// Most heavy stocked items, most aged stock items
show table "Most heavy stock items" a6c8 with
  id
  Items.Name
  Items.StockOnHand as "On Hand"
  Items.StockOnOrder as "On Order"
  Items.Fifo as "Value" { unit: #(currency) }
  order by Items.Fifo desc

show table "Most aged stock items" d6f8 with
  id
  Items.Name
  Items.StockOnHand as "On Hand"
  Items.Fifo as "Value" { unit: #(currency) }
  StockAge as "Age (days)"
  order by Items.Fifo * StockAge desc // mixing age and value on purpose

// Most pressured stock items
Items.D = sum(Orders.Quantity) where date >= oend - 13 * 7
where Items.StockOnHand + Items.StockOnOrder <= 0 and Items.D > 0
  show table "Most demanded unstocked items" a9c11 tomato with
    id
    Items.Name
    Items.D as "Units sold last quarter"
    order by Items.D desc

Items.V = sum(Orders.NetAmount) where date >= oend - 13 * 7
where sum(Items.V) by Items.Supplier > 0
  show barchart "Stock age by supplier { days}" d9f11 tomato with
    sum(Items.V * StockAge) / max(1, sum(Items.V))
    group by Items.Supplier
    order by sum(Items.V * StockAge) / max(1, sum(Items.V)) desc