Envision Language
Envision is the Domain-Specific Language (DSL) engineered by Lokad for the specific purpose of the predictive optimization of supply chains. This document is not intended for complete programming beginners, but rather for an audience already familiar with basic programming patterns like Microsoft Excel formulas.
Envision has been designed since day 1 with one key feature in mind: the possibility to perform automated script rewrites if the syntax were to evolve. During the first 5 years of operations, Lokad performed around one hundred incremental rewrites. Those rewrites ensure that all our client companies benefit from the latest version of Envision without having to manually revise their scripts. There are many areas in Envision’s syntax that we plan to adjust in the future. In this documentation, the areas of evolution that have already been clearly identified are pointed out in the Roadmap notes.
Unlike many scripting languages, Envision focuses on delivering a high-degree of correctness by design, which means capturing as many issues as possible at compile time (the moment when the script is compiled) rather than runtime (the moment when the script is run). Capturing issues at compile time is preferable because whenever the amount of processed data is sizable, a runtime issue can take a long time (several minutes) to manifest itself causing productivity and production reliability problems. This documentation focuses on the compile-time angles of Envision.
Table of contents
Your first script
Every script must display at least one dashboard tile. The following script illustrates how to generate a dashboard that contains a single tile displaying Hello World!.
greeting = "Hello World!"
show label greeting
All the statements that start with the keyword show indicate that a tile will be displayed. Tiles are the display mechanism provided by Envision. All the tiles present in a script are consolidated in a dashboard.
The value "Hello World!" is called a text literal, a value that appears verbatim in the code. The operator = is the assignment operator.
Short names
Every variable belongs to a table. For concision and clarity, the table name can be omitted when a scalar is involved. The script can be rewritten with the explicit table name:
Scalar.greeting = "Hello World!"
show label Scalar.greeting
The table name comes before the variable name, and the dot (.) is used as a separator between the two names.
The Scalar table is a built-in “ambient” table that always exists.
Beside scalars, Envision supports another mechanism for short-name variables, i.e. omit table names, through a default implicit table. This mechanism is used with dimensions. We will get back to the concept of dimensions in the following.
Comments
Comments are introduced with the double-slash //. They can be put at the beginning of a line, or to the right of the line.
// This is a full line comment.
greeting = "Hello, world!" // This is a trailing comment.
show label greeting
Comments can also be introduced with the alternative syntax /* */ which supports inlining.
greeting = "Hello, world!"
show label /* inline comment */ greeting /* this
                                            works
                                            too */
Structured documentation
Variables in Envision can be documented with with a triple-slash /// comment. In order to obtain the structured documentation behavior, the /// has to be put at the beginning of the line, and just before the documented variable.
/// This is a **bold** message,
/// and multiline works too!
greeting = "Hello, world!"

c = strlen(greeting)// Hover with your mouse on 'greeting', you get the message below.
The Markdown syntax is used for the structured documentation. In the above example, when hovering the variable greeting, the word bold appears in bold due to the use of the ** .. ** delimiters. An structured documentation block can include multiple lines.
Like comments, the structured documentation has no impact on the logic of the script.
Whitespaces
Envision is sensitive to whitespaces placed at the beginning of the lines. In this regard, its syntax is fairly similar to that of Python. For example, the following script is incorrect:
x = 42
  greeting = "Hello, world!" // WRONG! Whitespaces matter.
show label greeting
Whitespaces placed at the beginning of the line control the level of indentation. In Envision, adding an extra level of indentation is required whenever entering a block, for example:
greeting1 = "Hello"
greeting2 = "World"
show summary "Another Tile!" a1b2 with
  greeting1 // 2 spaces of indentation
  greeting2 // idem
The script above displays two text literals with a summary tile. Envision requires 2 whitespaces per level of indentation.
String interpolation
Envision supports what is commonly referred to as text interpolation for its text values.
x = 42
message = "My number is \{x}." // yields "My number is 42"
The syntax requires the variable to be included with a block \{..} (don’t forget the backslach \).
Envision does not support interpolating expressions, only variables.
Line structure
Envision is sensitive to line breaks. A script is divided into a number of logical lines. A logical line break typically indicates the end of a statement, but it can also indicate a new block - typically when the keyword with is used.
The backslash character (\) at the end of a line tells Envision to extend the current logical line over and across to the next physical line.
show \
label \
"Hello World!"
In the script above, there is only one logical line, but three physical lines. The lines are joined through the use of the backslash character.
The recommended practice with Envision is to keep lines under 120 characters. When facing very long lines, the backslash can be used to reorganize the code in physical lines of less than 120 characters.
As lines are joined, whitespaces can be introduced at the beginning of the line when a backslash is used. Thus, the following script works:
show \
  label \
    "Hello World!"
Line continuations
While Envision is sensitive to line breaks, it also offers implicit line continuation that does not rely on the use of backslashes. When the last token of a line is something that requires another token to be found, Envision expects the next line to be its continuation, i.e. the logical line extending to the next physical line. For example:
x = 2 +
40

show label "\{x}"
While this is not required, it is advised to introduce the proper level of indentation to make the code more readable, that is:
x = 2 +
     40

show label "\{x}"
Also, this process can be repeated over multiple physical lines:
x =  2 +
     20 +
     10 +
     10

show label "\{x}"
More generally, when found at the end of a line, all the unary and binary operators as well as the assignment operator imply that the next line is a continuation of the current line.
Conversely, when found at the beginning of a line, the keywords as, over, if, default, sort, scan, by, into, cross and at imply that the current line is a continuation of the previous line.
The semantic of all these keywords will be detailed in the following.
Functions
Envision features a rich library of built-in functions, which provides many capabilities that can not be replicated directly from the language itself. All functions operate on vectors and return vector results as well. Functions are free of side effects, i.e. the values passed as arguments to the functions are never modified by function calls.
Function calls start with the name of the function followed by an opening parenthesis (, then the arguments and finally the closing parenthesis ). For example, the abs() function returns the absolute value of a number:
x = abs(-42)
show label "\{x}"
More complex functions require several arguments. Most functions use positional arguments where arguments are specified according to their position in the function call. For example, the startsWith() function takes two text arguments and returns true when the text provided through the first argument starts with the text provided through the second argument:
x = startsWith("Hello World!", "Hello")
show label "\{x}"
Then, there are functions that take a varying number of arguments. Those functions are referred to as variadic. For example, the max function is variadic:
x = max(1, 3, 42, 12)
show label "\{x}"
Beware, the max function should not be confused with the max aggregator, which will also be detailed in the following.
Finally, certain advanced functions may contain a dot (.) in their name. This dot is only used for namespacing purposes, i.e. to clarify that multiple functions are closely related. However, there is no special semantic associated with the name suffix before the dot. For example, the function lastForex() returns the last known date, in Lokad, for a conversion rate between the currencies USD and EUR.
x = lastForex("USD", "EUR")
show label "\{x}"
The function lastForex() is obviously semantically related to the function forex(), which provides conversion rates at any point in the past, but otherwise deciding to call this function lastForex() rather than lastForex() is a (somewhat) arbitrary choice from the Lokad teams.
Labeled arguments (advanced)
Some functions, but only some functions, requires labeled arguments where arguments are specified via a label instead. Labeled arguments are newline-separated. Let’s illustrate this with forest.regress:
table Products = with
  [| as Product, as IsHighReturnRate |]
  [| "small white denim", false |]
  [| "small white shirt", true |]
  [| "small black denim", false |]
  [| "small black shirt", true |]
  [| "medium grey denim", false |]
  [| "medium grey shirt", true |]
  [| "large white denim", false |]
  [| "large white shirt", true |]
  [| "large black denim", false |]
  [| "large black shirt", true |]

table NewProducts = with
  [| as Product |]
  [| "small grey denim" |]
  [| "large grey shirt" |]

// The dot in 'forest.regress' function name is just namespacing.
NewProducts.IsHighReturnRate = forest.regress(
  trainingBow: Products.Product // beware, no comma, newline instead
  label: if Products.IsHighReturnRate then 1 else 0
  evaluationBow: NewProducts.Product) // beware, closing `)` must be on the same line than the last arg

show table "Classified" with
  NewProducts.Product
  mean(NewProducts.IsHighReturnRate) as "IsHighReturnRate"
In the above script, the function forest.regress() is called with three labeled arguments, namely, trainingBow (“bow” stands for bag-of-words), label and evaluationBow. This function performs a random forest regression based on the training dataset, and returns its regression results against the evaluation dataset. This script is a bit complex, we will be revisiting many elements in the following.
Labeled arguments are more verbose than positional arguments, but when many arguments are optional, or simply when the number of arguments is large, this syntax flavor is typically favored.
Envision does not allow alternating between positional arguments and labeled arguments for a given function. Each function is wired to either positional or labeled arguments.
User-defined function with labeled arguments are not supported. All the user-defined functions have positional arguments.
The vast majority of the built-in functions of Envision expect positional arguments. Labeled arguments are reserved a few complex functions, like forest.regress.
Call options for processes
In Envision, a process is a special sort of function that takes vectors as arguments instead of scalar values. The most frequent processes es the aggregators. The processes benefit from call options in addition to their regular function arguments.
These options provide general mechanisms that are similar across many functions. They are introduced by specific keywords such as at, by, sort or scan. For example, the following script illustrates how the lowest priced product can be extracted from a table:
table Products = with
  [| as Product, as Price |]
  [| "pants", 25 |]
  [| "shirt", 15 |]
  [| "socks", 5 |]

cheapest = first(Products.Product) sort Products.Price

show scalar "Cheapest" with cheapest
The function first (which happens to be an aggregator) has one positional argument Products.Product and one option Products.Price introduced by the sort keyword.
Call options are not available to pure functions, that just map scalar arguments to a return value (possibly a tuple).
Advanced remark: call options frequently hint about the degree of data parallelism that can be achieved by the underlying implementation of the function call. Some options, like by, tend to indicate that data can be partitioned, offering the possibility to speed-up the computation by processing groups independently. Some options, like scan, tend to indicate that the data has to be processed in sequence, preventing data parallelism.
Scoping and tuples
A variable’s scope is the section that represents the portion of the code where the variable can be used once the variable is declared. Envision provides several scoping mechanisms. The simplest scoping mechanism works as follows:
greeting = with
  x = "Hello World!"
  return x

show label greeting
The keyword with is used to introduce a block that is defined by its higher indentation level (just like in Python). The variable x is restricted to the block introduced by the with keyword. This block ends with the return statement. Attempting to use either x past the return statement would yield a compiler error.
A block introduced by with and ending with a return statement is referred to as a return block in Envision and it is intended as a pure scoping mechanism.
In addition, if x has been assigned before the with block, its previous value is restored upon leaving the block, as illustrated by:
x = "Hello?"

greeting = with
  x = "Hello World!"
  return x

show label x // Displays 'Hello?'
It would be possible to explicit all the tables involved with the following equivalent script:
Scalar.greeting = with
  Scalar.x = "Hello World!"
  return Scalar.x

show label Scalar.greeting
Then, a with scope can be used to return multiple variables in what is known as a tuple, a collection that is ordered and that has its length fixed at compile time. The script can be rewritten as:
g1, g2 = with
  x = "Hello"
  y = "World!"
  return (x, y)

show label "\{g1} \{g2}"
The use of parentheses in the return indicates a tuple. The tuple is deconstructed directly upon assignment. However, the deconstruction can also be done separately, as illustrated by:
x = with
  x = "Hello"
  y = "World!"
  return (x, y)

g1, g2 = x

show label "\{g1} \{g2}"
Here a pair (x, y) is returned, but assigned to a single tuple value x. The name x is used on purpose, twice in two distinct scopes, to illustrate the scoping mechanism. However, tuples cannot be assigned to variables: the only thing that can be done with a tuple is to deconstruct it into multiple variables.
The x tuple returned is distinct from the x text within the with block. Naming-wise, the collision is avoided: an outer variable does not collide with the with block. However, the with block can leverage variables that are assigned above it, as illustrated by:
y = "World!"

x = with
  x = "Hello"
  return (x, y)

g1, g2 = x

show label "\{g1} \{g2}"
The with block in the above reference includes the variable y, which is defined prior to the block.
Discards
When calling a function that returns a tuple (or when deconstructing a dimension), some of the elements may not be used. This triggers an unused assignment warning. In order to clarify that the intent is to ignore the element, a discard should be used. One indicates that a variable is a discard by assigning it the underscore (_) as its name.
ok, _ = tryParseDate("2020-05-01", "yyyy-MM-dd")
show label "\{ok}"
Encoding (international characters)
As a rule of thumb, the UTF-8 encoding is used everywhere in Lokad and thus, non-latin alphabets can be used almost everywhere. These characters may appear:
- in script comments
- in text values and text literals
- in file names
- in project names
Envision offers specific capabilities to deal with files that are not using UTF-8. This point will be covered in the section “Reading Files”.
The primary restriction is the variable names that are restricted to the latin alphabet, primarily to eliminate the entire class of issues related to the presence of homoglyphs in code.
Primitive data types
Every variable is originally constructed based on one or several primitive data types, or types for short. These types reflect the nature of the information (e.g. text or number). In Envision, all types are identified and validated at compile time, i.e. Envision is a strongly typed language. Non-primitive types include, for example, tuples that are a collection of types. In this section, all the primitive data types are reviewed. All the more complicated types processed by Envision are built on top of those primitive types.
Numbers
Numbers refer to a single-precision floating-point number. Envision supports the canonical arithmetic operations. For example:
x = (2 + 3) * 5 / (2 - 1)
show label "\{x}"
The numerical precision chosen in Envision is a tradeoff between compute performance, precision and simplicity. In practice, operations performed with these numbers usually deliver a 1/1,000,000 precision that vastly exceeds the requirements as far as supply chain optimization is concerned. Yet, if the goal is to compute the exact balance sheet of a large corporation down to the last cent, this precision is insufficient.
Advanced remark : The Envision numbers are primarily internally processed using the IEC 60559:1989 (IEEE 754) standard for binary floating-point arithmetic, i.e single precision. We do not expose higher precision numbers to supply chain scientists because our experience indicates that it would put an extra burden on them for little or no benefit. However, Lokad moves internally to double precision whenever relevant, as is the case with accumulators for example. Our goal is to constantly achieve higher-than-necessary precision from a supply chain perspective, without needlessly throwing processing power at unstable numerical recipes that should have been avoided in the first place.
Text
Text refers to UTF-8 encoded strings limited to 256 characters. Envision supports the canonical text operations. For example:
x = "😃"
y = "✅"
show label "\{x} and \{y}"
The UTF-8 encoding ensures that virtually all non-latin alphabets (eg. Chinese characters) can be processed by Lokad as well as Emoji and Dingbats. The latter prove themselves very useful for building highly visual yet concise reports with Lokad. The limitation of 256 characters is a tradeoff between compute performance and expressiveness. This limit is vastly sufficient for all supply chain purposes, including product labels and even the longest barcode identifiers. By enforcing a hard limit on the text length, Envision eliminates the entire class of out of memory exceptions that plagues regular programming languages whenever large amounts of data are processed.
Advanced remark : The support of emojis is dependent on the browser and OS (operating system) versions, so while Envision does support UTF-8 there may be situations where those advanced characters are not properly rendered. Then, the true limit of text values in Envision is somewhat complicated. Outside the basic multilingual plane (Unicode), a code point consumes two characters. Thus, text values in Envision cannot hold 256 surrogate pairs (e.g. emojis) for example. Nevertheless it remains sufficiently high to cope with reasonable supply chain scenarios.
Date
Dates refer to integral calendar days. The time of day is not part of the date. Dates, in Envision, support arithmetic operations. For example, in order to add 3 days to a given date, the following script can be used:
x = date(2020, 4, 12) // year, month, day
y = x + 3
show label "\{y}"
There are no date literals, but the function date(y,m,d) creates a date from the specified year, month and day inputs, as illustrated by the script here above.
The range of valid dates in Envision starts on Jan 1st, 2001 and ends on Jan 1st, 2180. The date-only data type offers superior compute performance compared to most implementations in other languages. Also, omitting the time removes entire classes of problems stemming from time zones.
Boolean
Booleans represent one of two values: true or false.
x = (not false) and (false or true)
show label "\{x}"
The logical operators are and, or and not.
The ternary if is written with the syntax:
x = if (not false) then 42 else 13
show label "\{x}" // displays '42'
Advanced remark : As Envision has no side effects, all logical operators could be interpreted as short circuit operators. While Lokad may take advantage of short-circuiting those operators for performance, it cannot be depended upon. For example a > 0 and b / a > 0 will fail because and is not guaranteed to short-circuit.
Ordinal
Ordinals represent opaque identifiers used by Envision to identify lines within a table. Most notably, dimensions as defined by Envision are frequently typed through ordinals when the dimension has to be auto generated. While, under the hood, ordinals are ubiquitous because it’s through them that many relationships are implemented, however direct interactions with ordinals are relatively infrequent.
table Products[pid] = with
  [| as Product |]
  [| "shirt" |]
  [| "pants" |]
  [| "socks" |]
In the script above, the dimension variable pid is of the ordinal type. The pid variable identifies every line of the Products table.
In Envision, little can be done with ordinals as they cannot be displayed and do not interact with other data types. Nevertheless, ordinals can be used in aggregation as arguments for the by option. They can also be used in table comprehensions. These points will be detailed in the following.
Ranvar
Ranvars represent random variables over Z (integers, positive and negative). Ranvars are intended for probabilistic reasoning about future uncertainties, such as uncertain demand, uncertain lead times, uncertain returns, etc.
show scalar "My Poisson" with poisson(3)
The script here above displays a Poisson distribution of parameter lambda = 3. Envision supports a whole algebra of random variables, which will be detailed in a later section.
Advanced remark : Under the hood, ranvars are nontrivial data structures. The naive histogram representation does not yield a satisfying performance, as tail probabilities can spread far into the integer spectrum, e.g. millions of units. Our ranvar implementation delivers strict upper bounds on both memory and CPU consumption. The unavoidable loss of precision and resolution is kept low enough to be inconsequential in supply chain situations.
Zedfunc
Zedfuncs represent functions from Z (integers) to R (real numbers). Zedfuncs are typically intended to represent the economic score of a potential decision, such as producing 0, 1, 2, 3, … units and assessing economic returns for every option.
show scalar "My Line" with linear(2)
The script above displays a linear function x --> 2 * x. Envision supports a whole algebra of zedfuncs, which will be detailed in a later section.
Advanced remark : Like ranvars, zedfuncs are nontrivial data structures. Our zedfunc implementation is also a tradeoff between performance, resolution and precision.
Markdown
Markdown is a popular plain text format for writing structured documents, based on formatting conventions from email and usenet. Within Envision scripts, markdown rendered tiles are handy to include in rich documentation that explains the dashboards and numbers they contain. The markdown type is a text format that has no limit on size (unlike the text type is limited to 256 characters) which makes it suitable for documentation. However, Markdown values can only be stored in the Scalar table.
prose = """
# Was it a car or a cat I saw?
The **quick** brown fox jumps over the _lazy_ dog.
"""
show markdown "" with prose
As illustrated above, the markdown type used a triple-quote """ syntax to delimit its content. Also, within the markdown section, line returns are treated as line Markdown line returns, not Envision ones. Finally, the tile markdown is a specialized tile dedicated to the display of Markdown content.
Advanced remark: Under the hood, we follow the CommonMark specification for Markdown. Also, we sanitize the Markdown to avoid injection attacks - which would still require script editor privileges - which could occur though naive Markdown rendering.
Literals
Several data types benefit from literals, namely text, number,boolean and markdown. When written plainly these literals belong to the Scalar table, as illustrated by:
myText = "Hello World!"
myNumber = 42.0
myBoolean = false
myMarkdown = """This is **bold**."""
However, literals are allowed to be prefixed with a table name (except markdown, which is restricted to the Scalar table anyway). So the script above can be rewritten as:
myText = Scalar."Hello World!"
myNumber = Scalar.42.0
myBoolean = Scalar.false
myMarkdown = """This is **bold**."""
Any table can be used as a prefix for a literal, not just the Scalar table. When another table is used as a prefix, the literal value is automatically broadcast to the specified table. Broadcasts will be covered in greater detail in the following.
Beware, in Scalar.42.0 the first dot and the second one don’t have the same semantic. The first dot indicates the table prefix, which is Scalar in the example above. The second dot is the decimal separator used for floating point numbers.
Dashboards and tiles
The tile is the fundamental display block in Envision. Envision supports many types of tiles such as barcharts, linecharts, tables, etc. A script can contain many tiles that will all be rendered in the same single-page dashboard. Nearly all tiles receive a table as input, introduced by the keyword with that renders this table in one form or another. For example, the following script displays two tiles:
show scalar "First title" with "Hello"
show scalar "Second title" with "World!"
The syntax to display a tile always includes a short series of elements:
- the
showkeyword, which indicates that a tile will be displayed. A tile is pure side-effect: it does not return any value, nor does it have any effect on any other tile. - the tile type keyword (
scalarin the example above), which specifies how the data passed as an input will be rendered. There are about a dozen types of tiles. - the tile title which should be a scalar text value, but not necessarily a text literal.
- the
withkeyword, required for all tiles exceptlabelone, which introduces the list of vectors to be used as the input for the tile. Here we are using the inline form of thewith, theblockform is introduced below.
Complex tables can be used as inputs for tile, as illustrated by:
table Products = with
  [| as Product |] // column's names
  [| "shirt" |]
  [| "pants" |]
  [| "socks" |]

Products.Size = "small"

show table "My Products" with Products.Product, Products.Size
Which displays the following table:
| Product | Size |
|---|---|
| shirt | small |
| pants | small |
| socks | small |
The script above creates a table, Products, then adds a second vector, Products.Size, to this table. Finally, the Products table gets displayed through a table tile, which as the name suggests is precisely intended to display tables in their original tabular format.
Pilling dozens of tiles, each tile being associated with input tables of millions of lines, in a single dashboard is reliable and performant in Envision. It is actually the intended way to use Envision and even the most complex dashboards are typically displayed under 500ms with a regular internet connection.
Naturally, we do not suggest producing complex dashboards for the sake of stress-testing Lokad. Dashboards should be kept as simple as possible as long they deliver the intended value. However, unlike Business Intelligence (BI) tools that emphasize a proliferation of screens, each one dedicated to a specific data angle, Envision emphasizes the consolidation of all the relevant information in a single dashboard with a near-instant display when visited.
Advanced remark: In order to achieve a fluid display of complex dashboards, Lokad uses a series of techniques. First, we consolidate all dashboard data into a single pre-computed data package, which gets downloaded through a single HTTP request. Unlike many tools in the market that perform one HTTP request per element in the dashboard, the number of HTTP requests is constant in Lokad no matter the complexity of the dashboard. This avoids the too-frequent problem of facing a piecewise display of the dashboard, where some elements take seconds or more to get displayed. Second, the data package leverages a smart selection of data that includes all the visible elements in the dashboard. Indeed, when displaying a table with millions of lines, it is not useful to push all those lines to the client browser while only the first dozen lines (or so) are displayed.
The with keyword used to define the input vectors of the tile can define a with block where the vectors are listed with one vector per line. The script above can be rewritten as:
table Products = with
  [| as Product |] // column's names
  [| "shirt" |]
  [| "pants" |]
  [| "socks" |]

Products.Size = "small"

show table "My Products" with
  Products.Product
  Products.Size
The vector inputs require an extra level of indentation, and the with block ends when the indentation comes back to its previous level. For complex tiles, the with block (as opposed to the inline with) is preferable for the sake for readability.
Then, all the input vectors passed as inputs don’t necessarily have to belong to the same table, as illustrated by the following script:
table Products = with
  [| as Product |]
  [| "shirt" |]
  [| "pants" |]
  [| "socks" |]

show table "My Products" with
  Products.Product
  "small"
In this script, the scalar text literal is implicitly broadcast to the Products table. In the previous script, there was also a broadcast, but it was an explicit one with Products.Size = "small". Here, the table tile leverages a common table mechanism that identifies which table should be used, Products in this case, and broadcasts accordingly all vectors that do not already belong to this common table. We will revisit this aspect in the following.
Positioning tiles
Tiles can be positioned within a dashboard by leveraging a grid layout similar to the one used in most spreadsheets, with columns identified by letters and lines identified by numbers. Tiles are positioned through code, however, Lokad also features a visual editor precisely intended to place and style tiles in a more convenient way than manual adjustments of constants in code. The following script illustrates the grid layout of Envision:
show label "A" a1 { backgroundColor: #8aa }
show label "B" a2 { backgroundColor: #aaa }
show label "C" b1c2 { backgroundColor: #caa }
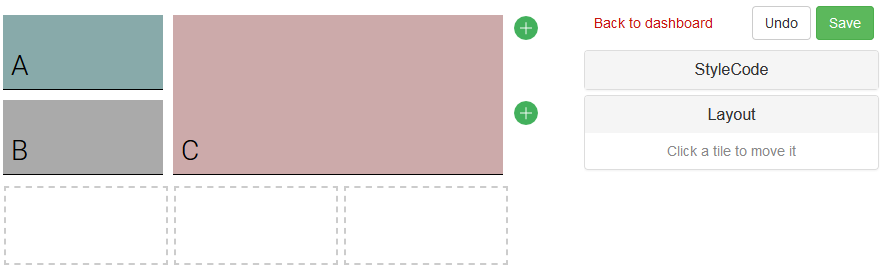
In the above script, the values a1, a2 and b1c2 are encoding the placement of the tile. The value a1 indicates that the tile starts on the column a and line 1, and by default, the height and width of the tile are equal to 1. The value b1c2 indicates that the tile starts on the column b and line 1 while it ends on the column c and line 2. The background color is defined - more on this in the next section - to help visualize where each tile starts and ends within the dashboard depending on its coordinates.
The syntax is unchanged when more complex tiles that involve input vectors are used:
myText = "Hello world!"
show scalar "A" a1 { backgroundColor: #8aa } with myText
show scalar "B" a2 { backgroundColor: #aaa } with myText
show scalar "C" b1c2 { backgroundColor: #caa } with myText

The position of the tile is an optional argument that immediately follows the title of the tile. However, in practice, it is strongly recommended to explicitly set the position of every tile, as the default behavior rarely yields nice looking dashboards: by default, Envision seeks from the lowest line to the first cell available up to the 8th column (i.e. h column) before going for the next line.
In the following, most of our script examples omit the position argument for the sake of concision, however, this choice should not be interpreted as a preference toward automatic dashboard layouts. The intended path in Envision is to carefully craft dashboards with well-placed tiles. In order to support this undertaking, Lokad supports a tile editor, which is distinct from the code editor. Both editors will be reviewed in greater detail in later sections.
Capitalization of the positions is ignored, thus b1c2 is identical to B1C2. The maximum number of columns is 26, i.e. z is the largest acceptable column identifier, while the maximum number of lines is 999. These values are (almost) absurdly large. As a rule of thumb, dashboards that exceed the column h or exceed the line 100 tend to be largely unreadable.
Styling tiles
The appearance of tiles can be controlled through a sublanguage referred to as StyleCode in Envision. StyleCode segments are introduced by curly brackets { and } and use semicolons as delimiters. A StyleCode snippet includes a list of rules, each rule starts with a property (on the left), followed by : and ends with a value. The following script illustrates StyleCode:
show scalar "A" a1 { backgroundColor: red; textColor: white } with
  "Hello World!"
This above StyleCode snippet introduces two rules. The first rule backgroundColor controls, as the name suggests, the color of the background of the tile. The second rule tileColor controls the color of the elements displayed in the tile. Named colors are being used for the sake of simplicity.
StyleCode is a powerful sublanguage and it isn’t covered exhaustively in this section. It will be revisited in greater detail in the section named “StyleCode”, including the coloring syntax.
The StyleCode snippet can be placed just before the with keyword in a show statement as done in the above script, but it can also equivalently be placed before the show statement as illustrated by:
{ backgroundColor: red; textColor: white }
show scalar "A" a1 with
  "Hello World!"
Then, as StyleCode snippets can become a bit verbose when many rules are involved, a multiline syntax is provided for the inline form:
show scalar "A" a1 {
  backgroundColor: red
  textColor: white
} with
    "Hello World!"
And equivalently for the prefix form:
{
  backgroundColor: red
  textColor: white
}
show scalar "A" a1 with
    "Hello World!"
StyleCode provides a fine-grained control over the elements within the tile. For example, the following script applies a distinct style to each input vector fed to a table tile:
{ textColor: blue }
show table "My table" b1c2 with
  "Hello" { as: "First column"; textColor: red }
  "World!" as "Second column"
First, the textColor property is set for the tile and all its elements. Second, the column Hello gets two more StyleCode rules: as which controls the column header and textColor which locally overrides the rule defined above. Third, the column World! gets one more StyleCode rule through the as shorthand.
The as property is a syntactic shorthand provided by Envision to avoid the usual StyleCode snippet delimited by { and }. Thus, writing as "Second column" or { as "First column" } are strictly equivalent. The shorthand as is introduced because most columns in most tables (tables are probably the most frequently used tile in Envision) end-up requiring a custom header.
Then, the multiline syntax introduced above also applies to element-level StyleCode snippets as illustrated by:
{ textColor: blue }
show table "My table" b1c2 with
  "Hello" {
    as: "First column"
    textColor: red
  }
  "World!" as "Second column"
The rules introduced by StyleCode cascade: a rule is recursively applied to all the sub-elements within its scope, until it is itself overwritten by a new rule. In the above example, the textColor rule is first applied at the tile level, and then overwritten at the column level.
Rule-wise, the topmost level is the dashboard itself. When a rule is applied to the dashboard itself, it applies to all the dashboard’s tiles, and thus all their sub-elements as well. In order to indicate that that StyleCode snippet targets the dashboard the @{ .. } syntax must be used, as illustrated by:
show table "My table" b1c2 with
   "Hello" as "First column" { textColor: red }
   "World!" as "Second column"

@{ textColor: blue } // '@' selects the dashboard itself
In the above script, the textColor is set to blue for all tiles . Thus, even if the StyleCode rule appears after the tile declaration, it still has an effect on it. StyleCode rules follow the hierarchy of the dashboard elements, not their order of appearance in the code, although the two are usually the same.
The script below is strictly equivalent to the one above, be aware however not to confuse the first StyleCode snippet prefixed with a @ (hence targeting the dashboard), with its counterpart without the @ where the snippet targets the table tile that immediately follows.
@{ textColor: blue } // '@' selects the dashboard itself
show table "My table" b1c2 with
  "Hello" as "First column" { textColor: red }
  "World!" as "Second column"
StyleCode values can be controlled directly through regular Envision vectors. While all the examples given so far were leveraging Envision literals, making the style data-dependent can be handy for producing rich dashboards, for example to outline certain important elements with bright colors. In order to inject an Envision vector into a StyleCode snippet, the syntax #[expr] must be used, as illustrated by:
table Products = with
  [| as Product, as Color |]
  [| "pants", "blue" |]
  [| "shirt", "pink" |]
  [| "socks", "green"|]

show table "My Products" a1b3 with
  Products.Product { textColor: #[Products.Color] }
  Products.Color
The #[expr] syntax can be used to introduce arbitrary Envision vector expressions, not just to reference an Envision variable as done in the above script. If the expression is scalar, then the #(expr) should be used instead.
Advanced remark: StyleCode is heavily inspired by CSS, both in syntax and in overall design. The semicolon ; is used as the rule delimiter rather than the comma in order to allow rules to potentially list a series of values. Then, the semicolon delimiter is omitted when opting for multiline, which is consistent with the overall Python-like syntax of Envision. The motivations for segregating the data layer (i.e. tile’s vector inputs) from the presentation layer (i.e. StyleCode snippets) is similar to the ones that lead to CSS in the HTML context, however there are a few distinctive elements as well. In particular, StyleCode offers the possibility to reskin a dashboard without either rerunning it or even recompiling it. This capability is a critical enabler for Lokad’s visual dashboard editor.