Slicing dashboards
Slicing is a mechanism to compute many variants of the same dashboard and let end-users interact with the resulting sliced dashboard through a search-like navigation. For example, through slicing, it is possible to create a product inspector which consolidates - for every product - all the KPIs and linecharts of interest.
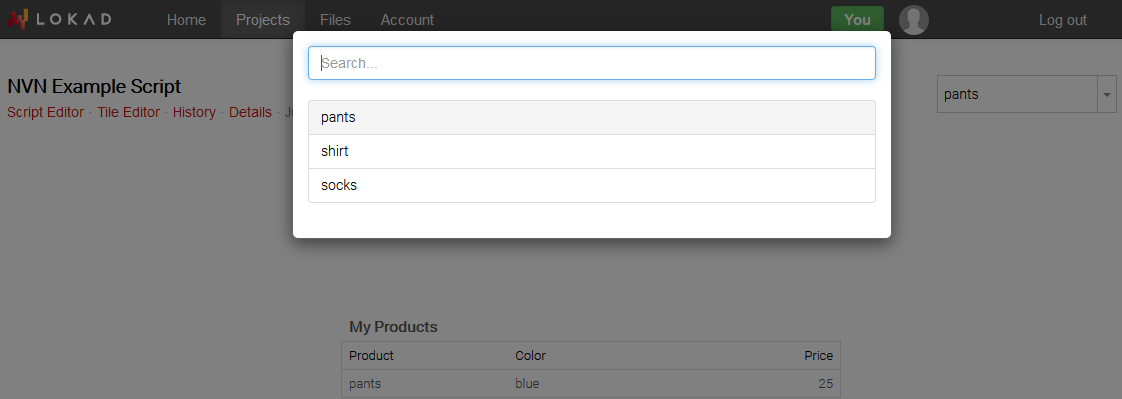
The following script provides a simplistic variant of such a dashboard:
table Products[pid] = with
  [| as Product, as Color, as Price |]
  [| "pants",   "blue",    25       |]
  [| "shirt",   "white",   15       |]
  [| "socks",   "green",   5        |]

table Slices[slice] = slice by pid title: Products.Product

show table "My Products" a1c3 slices: slice with
  Products.Product
  Products.Color
  Products.Price
In the above script, the creation of Slices[slice] takes one option Product.Product and a key by pid. The option is the title, or name, of the slice. Slice names become part of the dashboard user interface, as the slice selector offers the possibility to select slices displayed through their names. The option is the group of the slice, in a process highly similar to the group tables detailed in a previous section. Finally, the table tile gets sliced through the tile option slices: slice.
Note that we can reference slice instead of Products.slice, because the table Slices is upstream of the table Products (this is the result of Slices being generated as an aggregation over Products). Thus, there is a canonical broadcast of the dimension slices into the table Products.
In summary, we have:
Slices, a table. Each line of this table corresponds to a view of the dashboard that can be selected by the user.slice, the primary dimension of the tableSlices.slices, a labeled option that can applied to most tiles, to specify that the tile varies depending on the selected slice.
Slicing is a mechanism that impacts only tiles and only when specified at the tile level. When a tile is sliced, its input table (found as the common table among all its input vectors) gets partitioned across every single slice. The resulting tile is computed separately for each slice. Finally, the slice selector allows you to pick which slice gets displayed in the dashboard itself.
The table Slices can be defined at most once in an Envision script.
The option by behaves like it does for any aggregator, the only limitation being that the number of slices is limited to 200,000. In particular, it is possible to use multiple vectors through the usual syntax by [expr1, expr2, expr3].
The creation of the table Slices accepts an optional subtitle to specify a label (the first argument is the name, see above). The label can be used to enrich the slice selector as illustrated by:
table Products = with
  [| as Product, as Color, as Price |]
  [| "pants",    "blue",   25       |]
  [| "shirt",    "pink",   15       |]
  [| "shirt",    "white",  15       |]
  [| "socks",    "green",  5        |]

table Slices[slice] = slice by Products.Product // implicit line continuation
    title: Products.Product
    subtitle: join(Products.Color; ", ") by Products.Product sort Products.Color

show table "My Products" a1c3 slices: slice with
  Products.Product
  Products.Color
  Products.Price
In the script above, the second argument join(Products.Color; ", ") .. is the concatenation of the color values. Indeed, unlike the previous example, the shirt slice has two elements instead of one as we are grouping by Products.Product (while we were previously leveraging the autogenerated dimension Pid of the Products table).
The option by Products.Products is required in the script above, but this requirement is somewhat accidental. As the table Products appears on the left side of the assignment, into Products is added by default to any aggregation that does not specify its by on the right. However, in this case, the target table for the text concatenation is not the Products table by the Slices table itself. This quirk would also be eliminated by the future syntax (cf. roadmap above).
Advanced remarks: Envision, and its implementation by Lokad, is geared toward batch processing where scripts are run fast, from minutes (for the big ones) down to a few seconds (for the small ones). Once the execution of a script is complete, our goal is to maintain a latency under 500ms to display even very large dashboards over typical internet connections. However, our goal is not to run a script (even a small one) in milliseconds. Indeed, guaranteeing low latencies while supporting a language having the level of expressiveness of Envision is a devilishly difficult problem. The slicing mechanism can be seen as a way to cheat with latencies. Instead of being able to compute a small dashboard very fast (while enforcing plenty of restrictions on the computations themselves), Lokad precomputes up to a large number of dashboards (with no particular restrictions on the computations), and then serves the pre-computed results very fast. Under the hood, each slice remains stored on the server-side and only gets pushed to the client browser when the slice is effectively visited.