Basic margin analysis
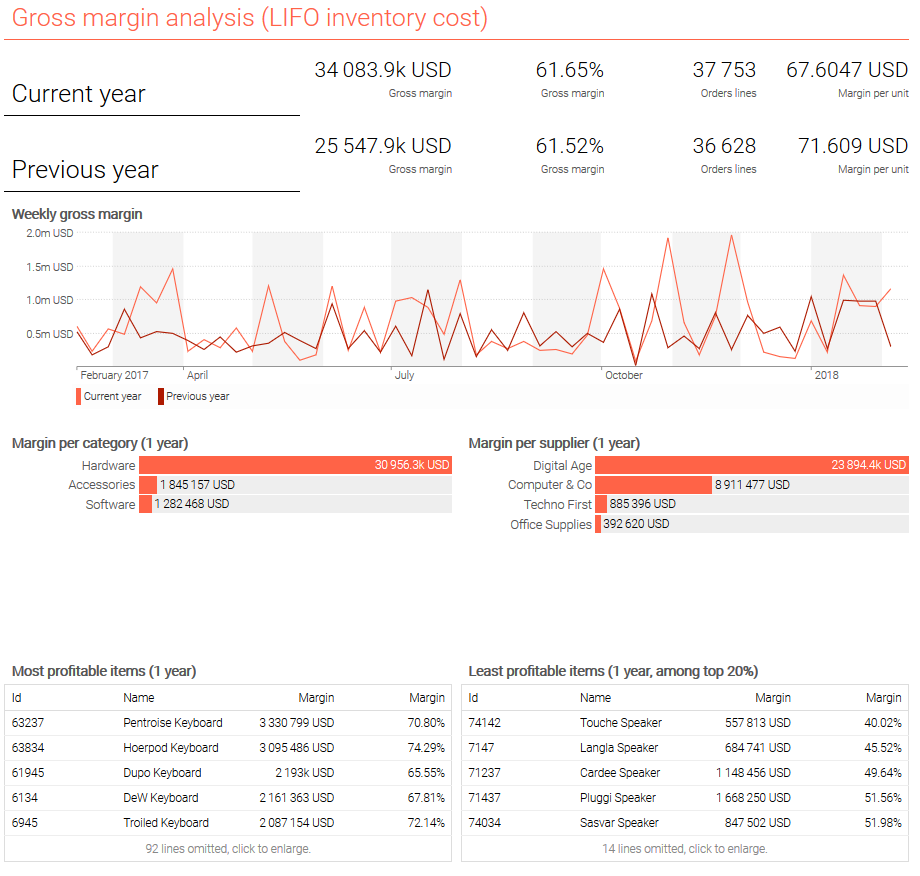
The script below illustrates how a gross margin analysis dashboard can be composed with Envision.
Check this script on the playground
read "/sample/Lokad_Items.tsv" as Items[id] with
  "Id" as id : text
  Name : text
  Category : text
  Supplier : text

read "/sample/Lokad_Orders.tsv.gz" as Orders expect [id, date] with
  "Id" as id : text
  "Date" as date : date
  Quantity : number
  NetAmount : number
  Currency : text

read "/sample/Lokad_PurchaseOrders.tsv" as PO expect [id, date] with
  "Id" as id : text
  "Date" as date : date
  Quantity : number
  NetAmount : number
  Currency : text

show label "Gross margin analysis (LIFO inventory cost)" a1f1 tomato

oend = max(Orders.date)
lastMonday = monday(oend)

// Default currency, and currency conversions
currency = mode(Orders.Currency) when (date >= oend - 365)
Orders.NetAmount = forex(Orders.NetAmount, Orders.Currency, currency, Orders.date)
PO.NetAmount = forex(PO.NetAmount, PO.Currency, currency, PO.date)

// LIFO inventory value
PO.UnitPrice = PO.NetAmount / max(1, PO.Quantity)
//Orders.CostAmount = latest(PO.UnitPrice) * Orders.Quantity
Orders.CostAmount = (last(PO.UnitPrice) by PO.id at Orders.id over [.. 0] ) * Orders.Quantity
Orders.Margin = Orders.NetAmount - Orders.CostAmount

// Top row of KPIs
show label "Current year" a2b2
where date >= oend - 365
  show scalar "Gross margin" c2 with sum(Orders.Margin) { unit: #(currency) }
  show scalar "Gross margin" d2 with sum(Orders.Margin) / sum(Orders.NetAmount) { unit: "%" }
  show scalar "Orders lines" e2 with count(Orders.*)
  show scalar "Margin per unit" f2 with
    sum(Orders.Margin) / sum(Orders.Quantity) { unit: #(currency) }

show label "Previous year" a3b3
where date >= oend - 2 * 365 and date < oend - 365
  show scalar "Gross margin" c3 with sum(Orders.Margin) { unit: #(currency) }
  show scalar "Gross margin" d3  with sum(Orders.Margin) / max(1, sum(Orders.NetAmount)) { unit: "%" }
  show scalar "Orders lines" e3 with count(Orders.*)
  show scalar "Margin per unit" f3 with
    sum(Orders.Margin) / max(1, sum(Orders.Quantity)) { unit: #(currency) }

// Linechart
Week.margin = sum(Orders.Margin)
where date >= lastMonday - 52 * 7 and date < lastMonday
  { unit: #(currency) }
  show linechart "Weekly gross margin" a4f6 tomato with
    Week.margin as "Current year"
    Week.margin[-52] as "Previous year"

// Split by category and supplier
where date >= oend - 365
  { unit: #(currency) }
  show barchart "Margin per category (1 year)" a7c9 tomato with
    sum(Orders.Margin)
    group by Items.Category

  { unit: #(currency) }
  show barchart "Margin per supplier (1 year)" d7f9 tomato with
    sum(Orders.Margin)
    group by Items.Supplier

// Tops and flops
where date >= oend - 365
where (sum(Orders.NetAmount) into Items) > 0
  show table "Most profitable items (1 year)" a10c12 with
    id
    Items.Name
    sum(Orders.Margin) as "Margin" { unit: #(currency) }
    sum(Orders.Margin) / sum(Orders.NetAmount) as "Margin" { unit: "%" }
    group into Items
    order by sum(Orders.Margin) desc

  Items.R = rankd(sum(Orders.Margin))
  where Items.R <= 0.2 * max(Items.R) by 1
    show table "Least profitable items (1 year, among top 20%)" d10f12 with
      id
      Items.Name
      sum(Orders.Margin) as "Margin" { unit: #(currency) }
      sum(Orders.Margin) / sum(Orders.NetAmount) as "Margin" { unit: "%" }
      group into Items
      order by sum(Orders.NetAmount) / sum(Orders.Margin) desc